Permafrost
The frozen ground that stores twice the carbon of the atmosphere is not permanently frozen at all: it only has to last two years.
Permafrost is ground that stays at or below 0 °C for at least two consecutive years. The name promises permanence, but the definition only asks for two years; today the oldest known permafrost has held for about 700,000 years while much of the rest is thawing. The northern permafrost region holds roughly 1,460 to 1,600 PgC, about twice the carbon in the atmosphere, of which 1,070 to 1,360 PgC sits in frozen soil and deposits. Thaw splits into a slow gradual path and an abrupt path through thermokarst lakes, thaw slumps and yedoma collapse, which occupies under a fifth of the permafrost zone but may reach half the stored carbon; IPCC AR6 assesses a carbon dioxide feedback of 18 PgC per 1 °C of warming by 2100 while noting most climate models still omit permafrost carbon. Damage is already priced: $248.6 billion of fixed assets stand on Russian permafrost, and projected mid-century costs run to $105 billion in Russia and $182 to $276 billion across the Arctic.
Definition and Naming
Permafrost is ground that remains at or below 0 °C for at least two consecutive years. The definition rests on temperature alone: ice content, moisture, overlying snow and geographic location do not enter the test. Above the permanently frozen material lies a seasonally thawed active layer. The frozen ground may consist of soil, sand, sediment or rock, and its thickness ranges from less than 1 metre in some places to greater than 1,500 metres in others. Permafrost occurs both on land and beneath offshore Arctic continental shelves.
The term joins perma-, meaning permanent, with frost. The name overstates its subject: the oldest permafrost has been continuously frozen for only about 700,000 years. Scientists also avoid saying that thawing permafrost melts, because frozen soil that has thawed is still solid. Although temperature is the sole criterion, some permafrost carries more than 30 percent ice in lenses and layers, and ground ice can reach up to 90 percent of the volume in syngenetic permafrost deposits.
1. Classification, Thickness and Extent
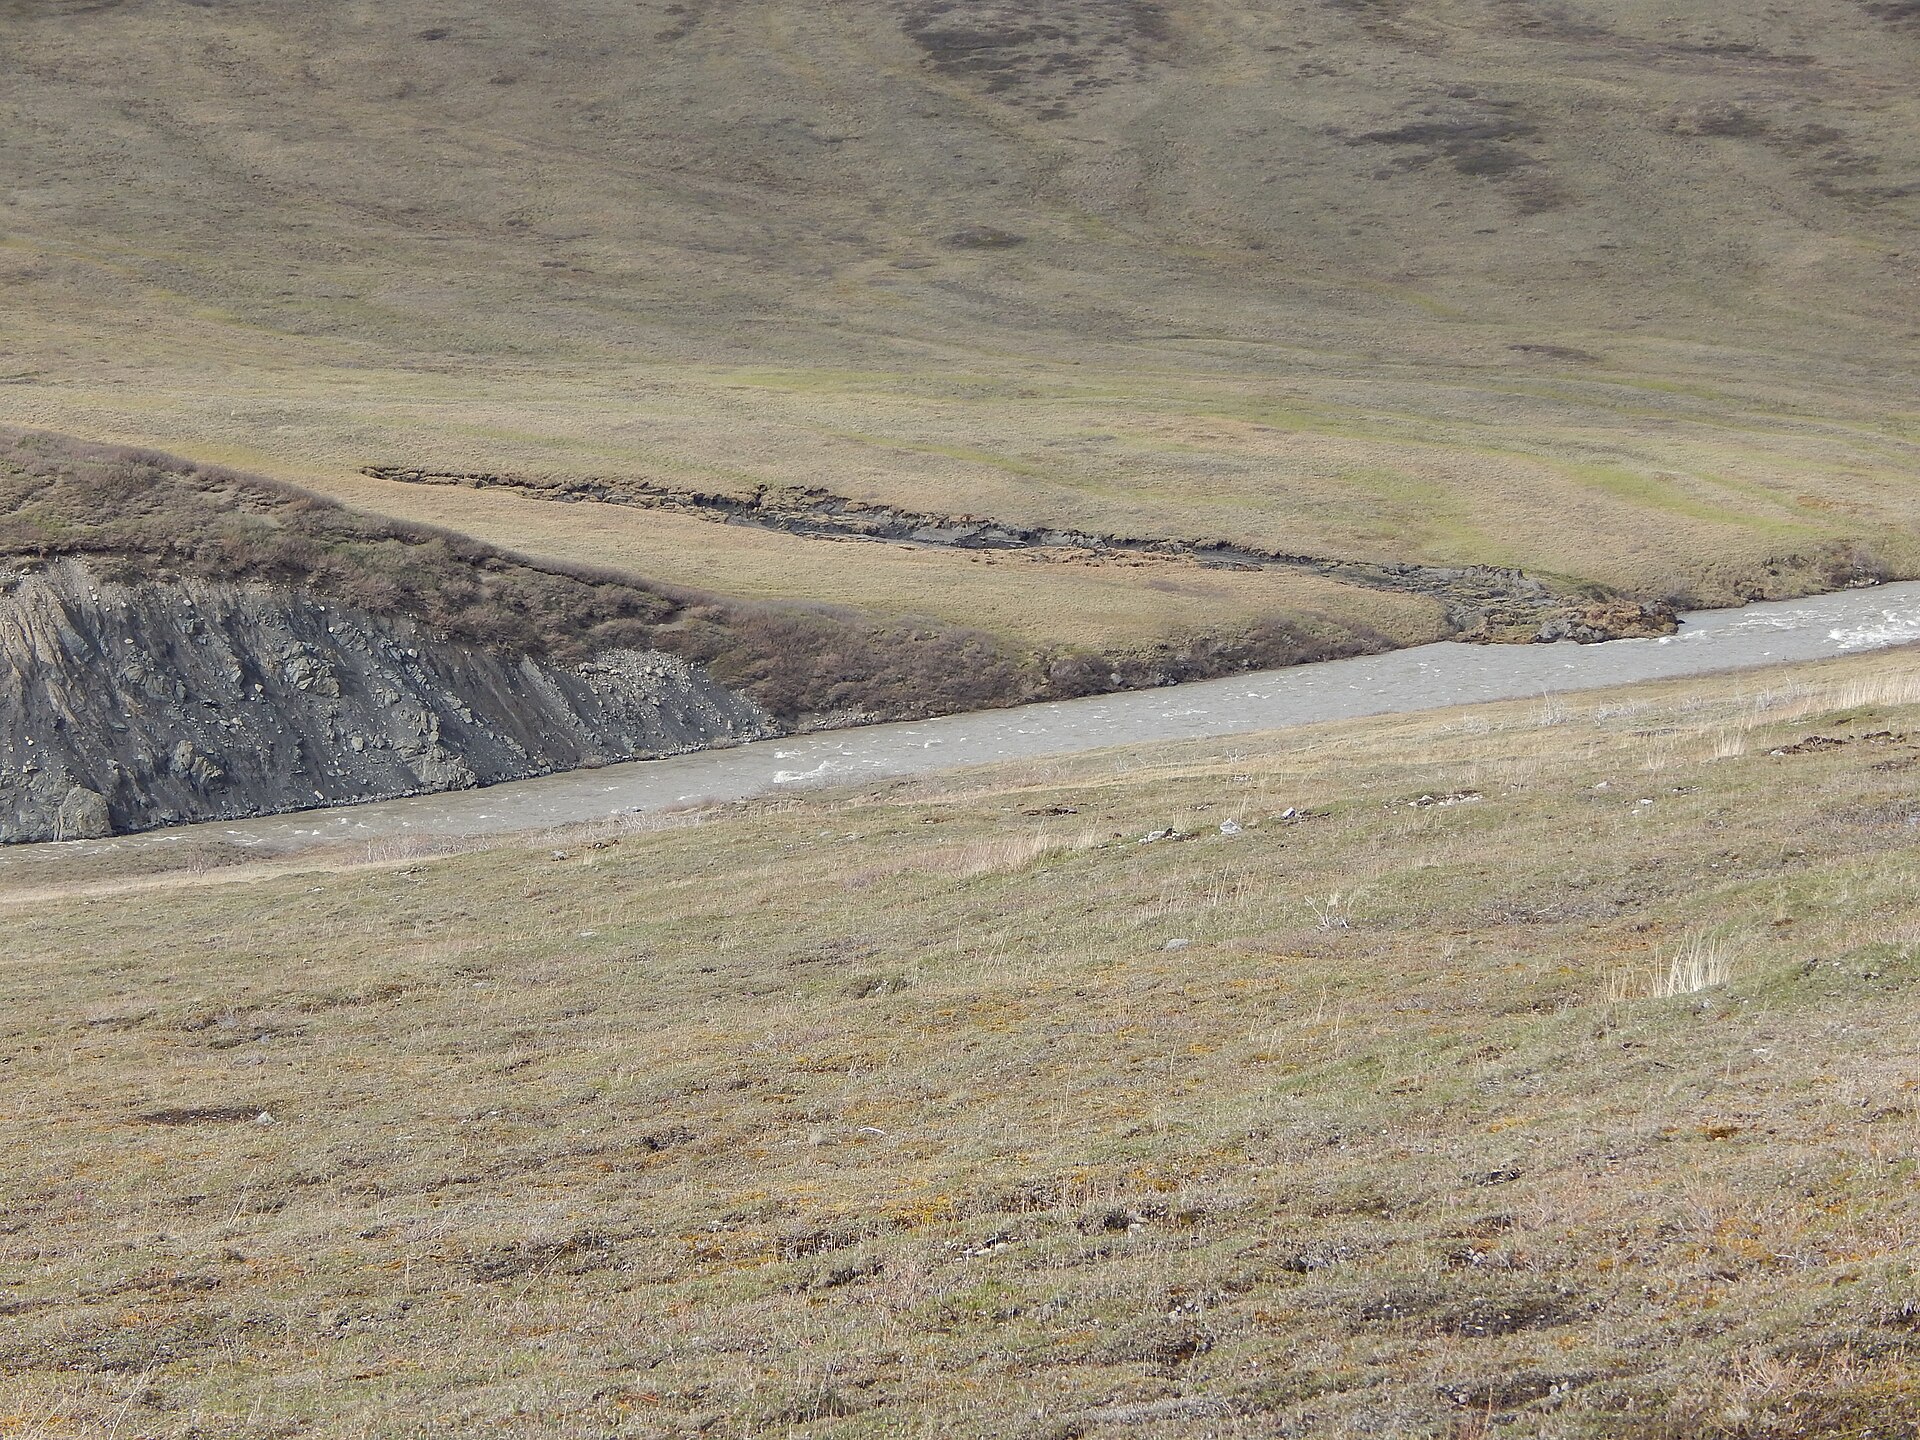
Permafrost is commonly divided into continuous and discontinuous zones, a classification that turns on how much of the ground remains frozen throughout the year. Lakes and rivers that do not freeze to the bottom interrupt the frozen ground and leave gaps within the continuous zone.
Thickness varies enormously, from under 1 m to more than 1,500 m. The deepest known sections lie in northern Siberia at 1,500 metres and in northern Alaska at 740 metres, and the frozen layer thins progressively toward the south. Permafrost is widespread in 85 percent of Alaska and 55 percent of Russia and Canada, and it probably underlies all of Antarctica. In the Northern Hemisphere it covers about 22 million km2, roughly 15% of the land surface. It underlies more than 50 percent of the unglacierized land north of 60 degrees north, while mountain permafrost accounts for roughly a quarter to three tenths of the global area.
Ground ice is classified relative to dry soil mass. When ice exceeds 250 percent of the dry soil mass it is termed massive ice, with beds at least 2 m thick and 10 m wide. Ice content can reach up to 90 percent of volume in syngenetic deposits, so the ice itself, not only the frozen soil, governs how the ground behaves when it thaws.
2. Thermal State and Observed Warming
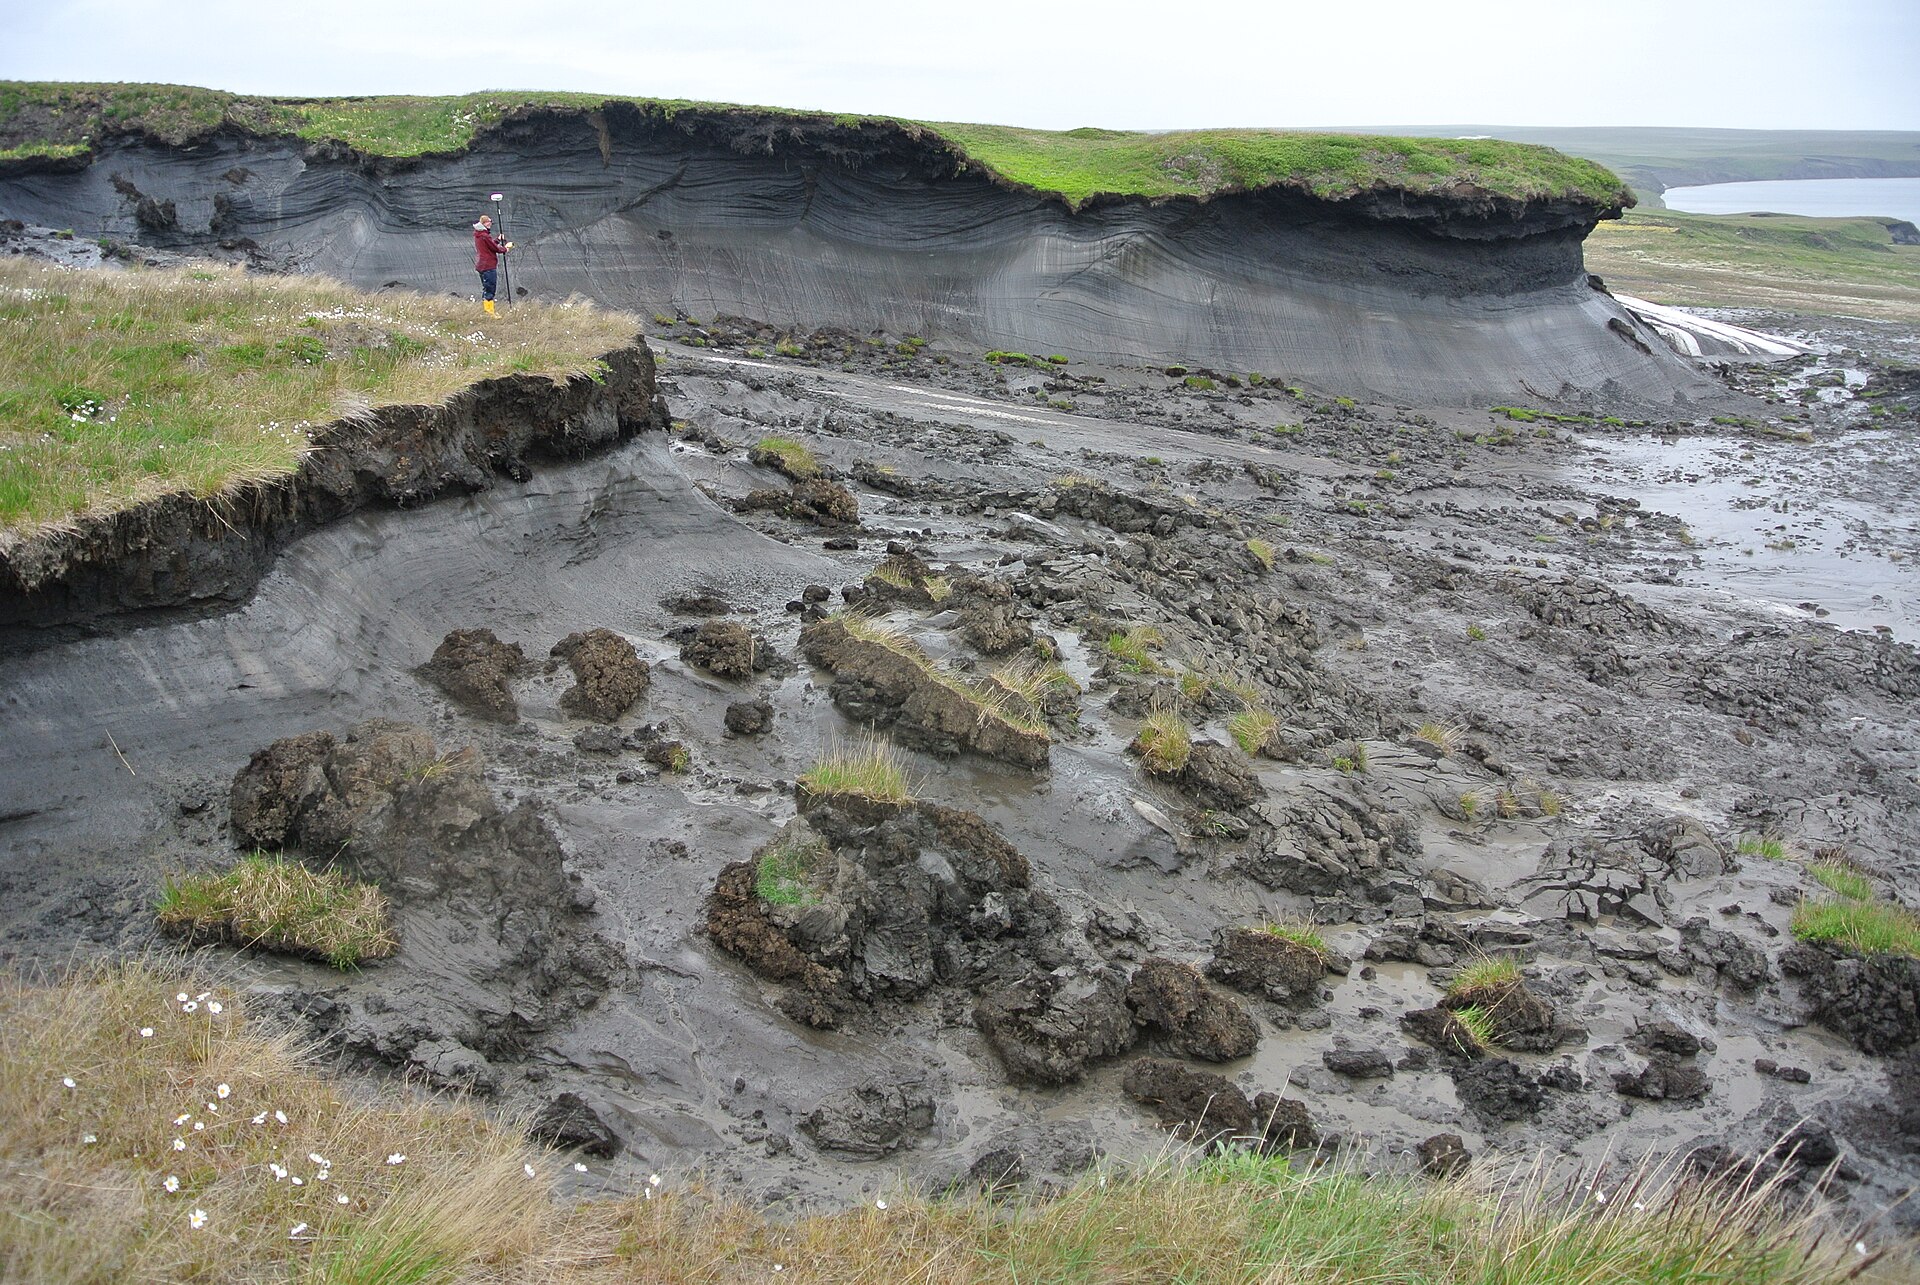
The thermal state of permafrost is now measured directly, and the record shows sustained change. In 2016 permafrost temperatures reached record highs across the Arctic, with the largest increases since 2000 recorded in the northern circumpolar region. Ground temperatures at 20 m depth on the North Slope tracked air temperature trends closely over the same period.
The active layer, the shallow horizon that thaws each summer, offers the most immediate signal. At 20 North Slope sites in 2016 average active-layer thickness was 0.52 m, 4 cm above the 21-year average and a 21-year maximum.
Warming of the ground translates into carbon loss, and the assessed scale is large. About 25% of the carbon held in the top 3 m volume is lost per 1 °C of warming. Of the total carbon stored in permafrost, 65 to 70 percent, or 1,035 plus or minus 150 Pg, lies in the surface 0 to 3 m layer alone. AR6 assesses the permafrost carbon dioxide feedback at 18 PgC per 1 C of warming by 2100 with a 3.1 to 41 PgC range, and a separate methane term of 2.8 PgC-equivalent per 1 C.
Confidence in the direction of the feedback is not matched by confidence in its details. AR6 concludes there is high confidence that thawing terrestrial permafrost will release carbon, but only low confidence on timing, magnitude and the split between carbon dioxide and methane. Abrupt thaw processes can contribute up to half of the total net greenhouse gas release from permafrost loss, with the rest from gradual thaw. Emissions from abrupt thaw across 2.5 million square kilometres could give a climate feedback as large as gradual thaw across the whole 18 million square kilometre permafrost region under the RCP8.5 pathway. After allowing for stabilisation, lake drainage and plant regrowth, models that consider only gradual thaw substantially underestimate permafrost carbon emissions.
Observations suggest the release may already be under way. Independent flux measurements suggest the permafrost region may already be releasing a net 0.3 to 0.6 Pg of carbon a year to the atmosphere. A pan-Arctic synthesis found carbon release in winter 2 to 3 times higher than ground-based estimates, enough for the whole region to be a source of about 0.6 Pg of carbon a year. Because deep anoxic sediments are missing from carbon feedback estimates, the impact of permafrost thaw may be more substantial than currently anticipated.
Across 70 permafrost and non-permafrost ecosystems, the annual carbon sink grew in non-permafrost sites but not in permafrost sites despite similar gains in summer uptake. That gap is attributed to non-growing-season carbon losses, and water and nutrient availability are expected to predict how these ecosystems respond to further warming.
A distinct methane pathway emerges from lakes. The new lake methane source added by the model, roughly 27 Tg a year by mid-century under the strong-warming pathway, is nearly triple the 10 Tg rise in global methane sources seen over the preceding decade.
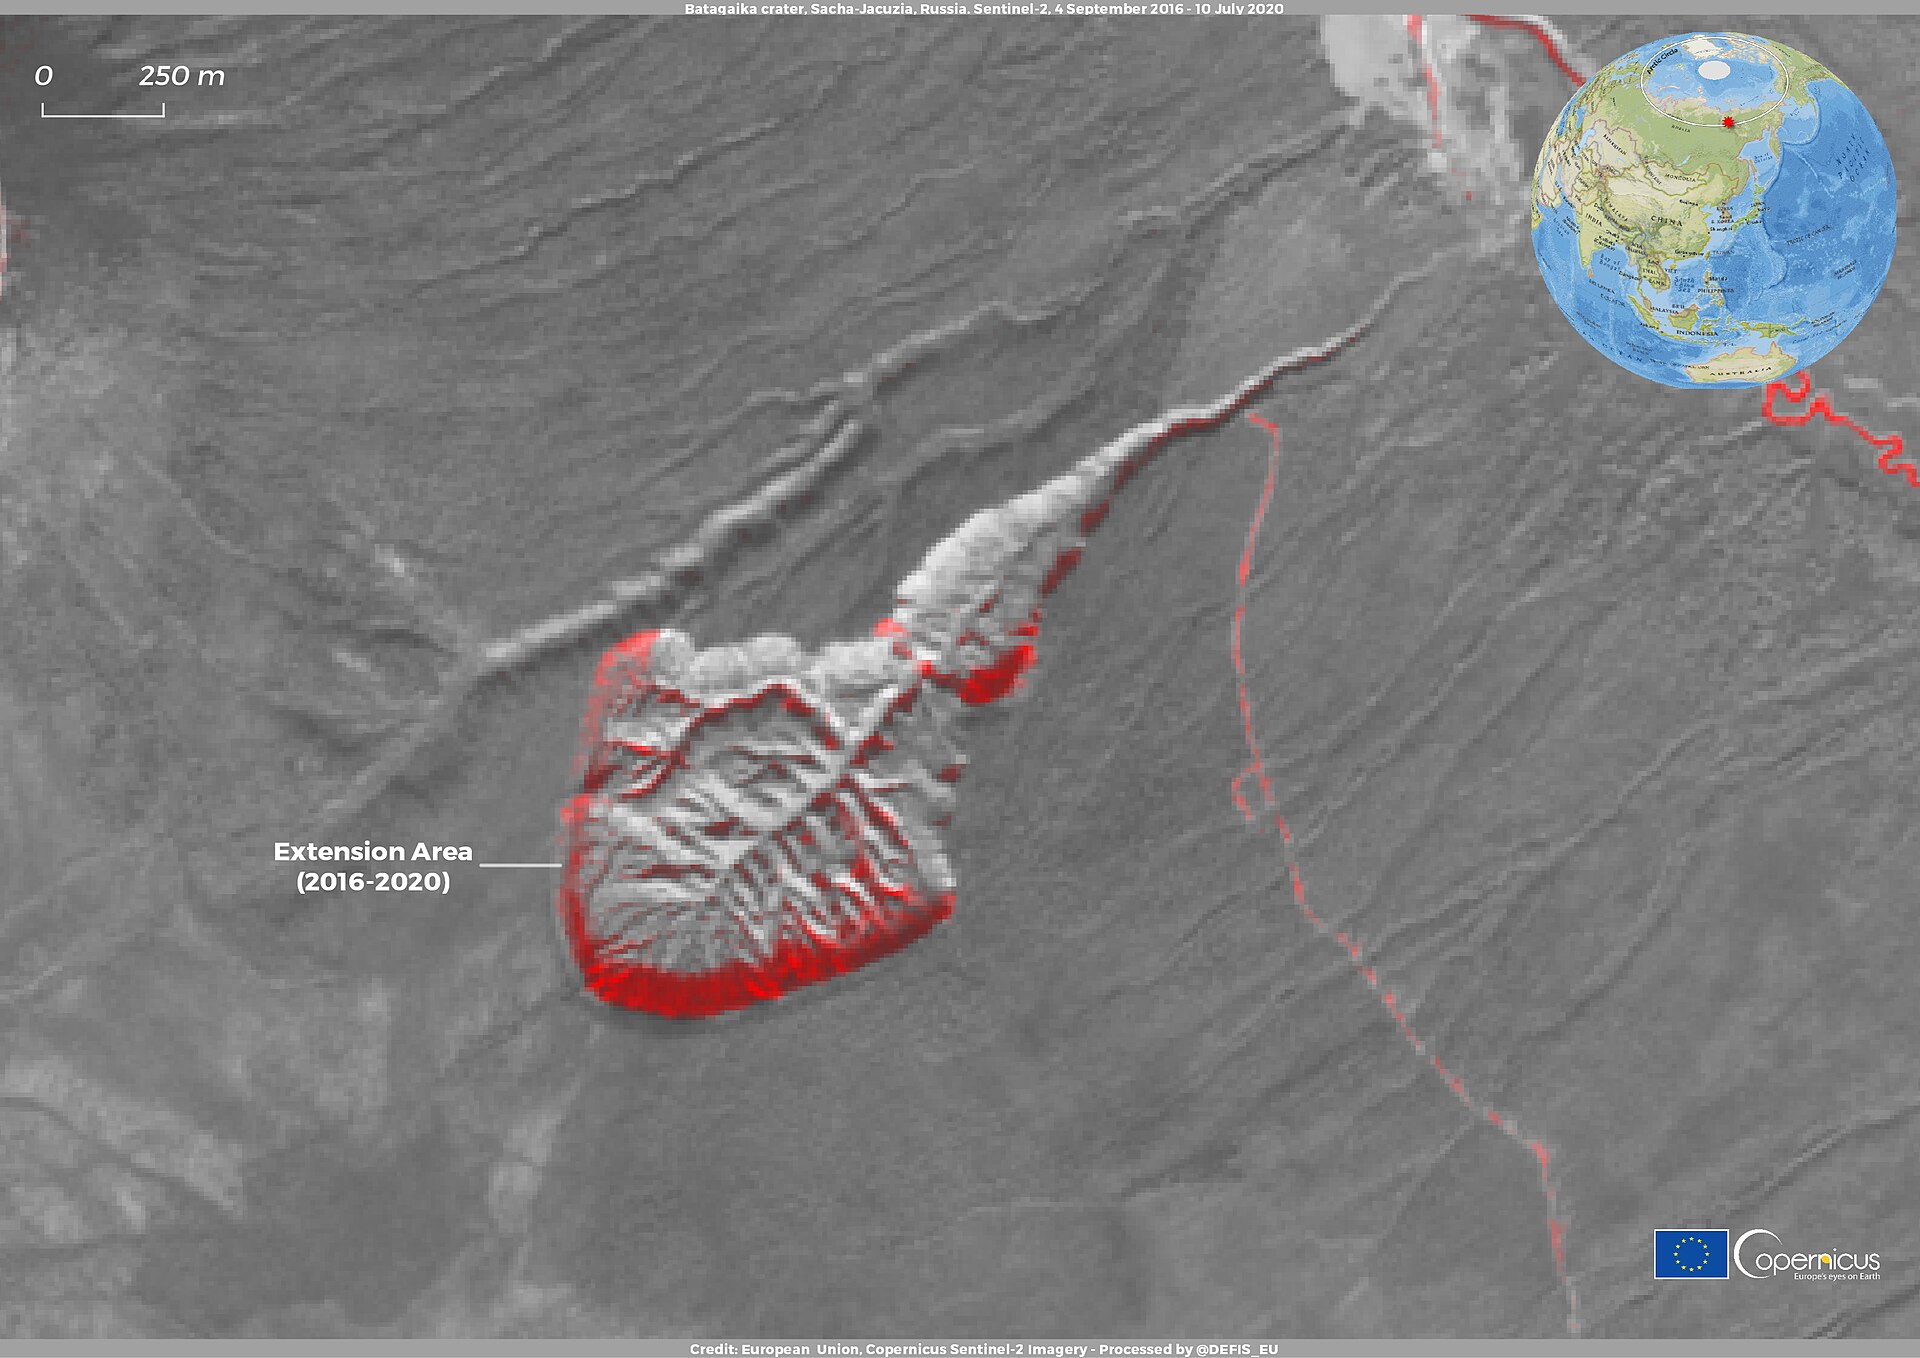
Precipitation-driven slumps become rarer northwards while temperature-driven ones rise sharply. At Batagaika, described by USGS as a widening chasm and the world's largest permafrost crater, the feature has been tracked in satellite imagery from declassified photographs of the 1960s. NASA Earth Observatory describes it as a megaslump whose cliff faces top 85 metres in places, the biggest permafrost crater in the world, retreating backwards into the hillside. As melting debris comes loose at the crater floor, more face is exposed to the air, which speeds thaw, so the feature is expected to eat through the whole hillslope. The slump has disgorged Pleistocene animals since it began growing, likely in the early 1980s, including a steppe bison and a horse species, plus cave lion and wolf remains.
A pan-Arctic study from 2022 puts the cost of permafrost degradation to infrastructure at 182 billion dollars by mid-century under a moderate pathway and 276 billion under a high-emissions one. A 1.5 C rise in mean annual air temperature is estimated to be enough to trigger deformation of almost all foundations in Yakutsk. Nearly 70 percent of Arctic infrastructure is at high risk by mid-century, including 30 to 50 percent of critical infrastructure, with costs in the tens of billions. On the Qinghai-Tibet Plateau, 30 percent of 9,389 km of roads already show permafrost thaw damage, and about 60 percent of infrastructure would be at high risk by the end of the century. Holding warming at 1.5 C instead of 2 C sharply changes the outlook there: fewer than 20 percent of railways at high risk by 2100 at 1.5 C, against 60 percent at 2 C.
3. Carbon Stored in Permafrost
The thaw-vulnerable carbon held in the yedoma region totals about 211 Gt, a figure derived by applying field data and geospatial extrapolations to the northern permafrost deposits. That total divides into 83 Gt stored in yedoma deposits and 128 Gt in thermokarst deposits.
The scale of this reservoir becomes apparent when the fate of the carbon is considered. Winter carbon dioxide loss from permafrost regions could rise 41 percent over the next century if emissions continue at their current pace, or 17 percent if they are modestly reduced. Sue Natali of the Woods Hole Research Center, the lead author of the winter flux study, says winter loss may already be offsetting growing-season carbon uptake across the Arctic.
Thaw does not release carbon only gradually. Thaw slumps released about 0.002 Pg of carbon a year, roughly 0.2 percent of estimated annual gradual thaw emissions, so slumping is a small but measurable part of the picture.
Within that region the yedoma deposits account for 83 Gt and the thermokarst deposits for 128 Gt, the latter exceeding the former. Together they make up the approximately 211 Gt total assessed by Strauss and colleagues.
A deep-learning survey of ArcticDEM identified 2,747 active retrogressive thaw slumps across the Northern Hemisphere, which together lost 317 million cubic metres of ground over the preceding decade.
Those thaw slumps released about 0.002 Pg of carbon a year, roughly 0.2 percent of estimated annual gradual thaw emissions, so slumping is a small but measurable part of the picture.
The drivers of thaw slumping vary with latitude: precipitation-driven slumps become rarer northwards while temperature-driven ones rise sharply.
Projected Feedback and Model Gaps.
Thawing terrestrial permafrost is expected with high confidence to release carbon, yet the assessment assigns only low confidence to the timing, the magnitude and the division of that release between carbon dioxide and methane.
Landforms and Ground Ice Features.
The Batagaika depression is described by USGS as a widening chasm and the world's largest permafrost crater. NASA Earth Observatory characterizes the same feature as a megaslump whose cliff faces top 85 metres in places, the biggest permafrost crater in the world, retreating backwards into the hillside.
Since it began growing the slump has disgorged Pleistocene animals, among them a steppe bison and a horse species, together with cave lion and wolf remains. The crater has been tracked in satellite imagery from declassified photographs of the 1960s.
4. Infrastructure and Settlements
Yakutsk and Norilsk are the only two large cities built in continuous permafrost.
By 2022 up to 80 percent of buildings in some northern Russian cities had already suffered damage, and 45 percent of oil and gas facilities are believed to be at risk. On the Qinghai-Tibet Plateau 30 percent of 9,389 km of roads already show permafrost thaw damage, and about 60 percent of infrastructure would be at high risk by the end of the century.
Yakutsk and Norilsk: the only two large cities built in continuous permafrost4Permafrost · Wikipedia ↗
Recommended pile depth in Yakutsk: 15 metres4
Northern Russian cities: up to 80 percent of buildings in some cities already damaged by 20224
Oil and gas facilities believed at risk: 45 percent4
Qinghai-Tibet Plateau roads already showing thaw damage: 30 percent of 9,389 km4
Qinghai-Tibet Plateau infrastructure at high risk by end of century: about 60 percent4
Environmental Hazards and Deep Biology.
The hazards that permafrost poses are not confined to the slow deformation of thawing ground. In 2020 a diesel tank at a power plant in Norilsk collapsed, releasing 6,000 tonnes of fuel onto land and 15,000 into water, a spill that reached Lake Pyasino.
Permafrost is not sterile: a gram of frozen soil may hold between 1 and 1,000 million microorganisms, many of them unculturable bacteria and fungi. The depth of that preservation is shown by the revival in 2012 of Silene stenophylla by Russian researchers, working from 30,000-year-old tissue found in an Ice Age squirrel burrow in Siberian permafrost. That tissue is the oldest plant tissue ever revived.
5. Measurement History
- 1836Shargin shaft measurements at YakutskAlexander Theodor von Middendorff measured temperatures to about 100 metres and estimated the permafrost there at 215 metres thick 7Permafrost · Encyclopaedia Britannica ↗.
- 2016Record Arctic permafrost temperaturesPermafrost temperatures were the highest on record at most Arctic observation sites, with the largest increases since 2000 in the coldest ground of the Alaskan and Canadian Arctic and Svalbard 2Terrestrial Permafrost - Arctic Report Card 2017 · NOAA Arctic Program ↗.
- 2016North Slope active-layer maximumAverage active-layer thickness at 20 North Slope sites was 0.52 m, 4 cm above the 21-year average and a 21-year maximum 2.
6. Key Figures at a Glance
| Quantity | Value | Source |
|---|---|---|
| Northern permafrost region carbon stock | 1460 to 1600 PgC | 9AR6 WG1 Chapter 5: Global Carbon and other Biogeochemical Cycles (Box 5.1) · IPCC ↗ |
| Carbon held in permafrost soils and deposits | 1070 to 1360 PgC | 9 |
| Carbon dioxide feedback per 1 C of warming by 2100 | 18 PgC (range 3.1 to 41 PgC) | 9 |
| Methane term per 1 C of warming | 2.8 PgC-equivalent | 9 |
| Active retrogressive thaw slumps in the Northern Hemisphere | 2,747 | 14Volumetric quantifications and dynamics of areas undergoing retrogressive thaw slumping in the Northern Hemisphere · Nature Communications ↗ |
| Ground lost by those slumps over the preceding decade | 317 million cubic metres | 14 |
7. Frequently Asked Questions
How much of Northern Hemisphere land does the permafrost region underlie?
The IPCC places the global permafrost region at about 22 million square kilometres and states that it underlies about 15 percent of Northern Hemisphere land6AR6 WG1 Chapter 9: Ocean, Cryosphere and Sea Level Change · IPCC ↗.
How much organic carbon does the northern permafrost region hold, and how much of it lies in frozen soils and deposits rather than thawed topsoil?
IPCC AR6 Chapter 5 estimates 1460 to 1600 PgC of organic carbon in the northern permafrost region, with 1070 to 1360 PgC of that total held in permafrost soils and deposits rather than merely in the thawed topsoil9.
What does abrupt thaw add beyond gradual thaw?
Abrupt thaw emissions from 2.5 million square kilometres could produce a climate feedback as large as that of gradual thaw across the whole 18 million square kilometre permafrost region under the RCP8.5 pathway10Carbon release through abrupt permafrost thaw · Nature Geoscience (Turetsky et al.) ↗.
8. Timeline
- 1836First serious Western measurementAlexander Theodor von Middendorff measures temperatures to about 100 m in the Shargin shaft at Yakutsk and estimates the permafrost there at 215 m thick.
- 1943The word permafrost enters EnglishSiemon Muller publishes a classified US Army engineering report that coins 'permafrost' as a contraction of permanently frozen ground, translating the Russian vechnaia merzlota.
- 1990One map for the northThe International Permafrost Association calls for a single unified map of permafrost distribution across the Northern Hemisphere.
- 2007Warming shows up at depthThe IPCC begins reporting systematic warming of permafrost boreholes: global permafrost temperatures rise 0.29 °C over the decade to 2016.
- 2012A 30,000-year-old plant revivesRussian researchers regrow Silene stenophylla from tissue recovered from an Ice Age squirrel burrow in Siberian permafrost, the oldest plant tissue ever revived.
- 2016Record ground temperaturesPermafrost temperatures hit record highs at the majority of Arctic observation sites, with the strongest gains in the coldest permafrost of Alaska, the Canadian Arctic and Svalbard.
- 2018Abrupt thaw enters the accountingWalter Anthony and colleagues show that emissions from abrupt thaw beneath thermokarst lakes more than double the radiative forcing from circumpolar permafrost soil carbon this century.
- 2019The Russian bill is pricedStreletskiy and colleagues value fixed assets on Russian permafrost at $248.6 billion and project $105.07 billion of climate-driven infrastructure damage by mid-century.
- 2020Norilsk spill exposes thaw riskA diesel storage tank at a Norilsk power plant collapses, spilling 6,000 tonnes of fuel onto land and 15,000 into water, a disaster linked to thawing permafrost.
- 2021AR6 quantifies the feedbackIPCC AR6 assesses a permafrost CO2 feedback of 18 PgC per 1 °C of warming by 2100 and notes that most CMIP6 models still omit permafrost carbon.
- 2024Deep lake sediments countedIncubating a 20 m core, researchers find anaerobic carbon dioxide and methane production from deep thawed sediment commensurate with aerobic production, with double the global warming potential.
- 2025Thaw slumps mapped pan-ArcticA deep-learning survey of ArcticDEM identifies 2,747 active retrogressive thaw slumps across the Northern Hemisphere, releasing about 0.2% of annual gradual thaw emissions.
9. Frequently asked questions
Does permafrost have to contain ice to count as permafrost?
How much organic carbon does the northern permafrost region hold?
Estimates place 1460-1600 PgC in the northern permafrost region, of which 1070-1360 PgC sits in permafrost soils and deposits rather than merely in thawed topsoil 9. That soil carbon adds about 50 percent to the global 0 to 3 m soil carbon inventory while occupying only 15 percent of global soil area 8Permafrost and the Global Carbon Cycle - Arctic Report Card 2019 · NOAA Arctic Program ↗.
How fast has permafrost actually been warming?
How much permafrost volume is expected to disappear as the climate warms?
The volume of perennially frozen soil in the top 3 m is projected to fall by about 25 percent for each 1 °C of global surface warming, holding up to 4 °C above pre-industrial 6. At sustained warming of 1.5 to 2 °C the loss reaches up to 50 percent against the 1995 to 2014 baseline, and at 3 to 5 °C up to 90 percent 6.
What does permafrost degradation cost Russia and the Arctic?
Fixed assets on permafrost in nine Russian regions were valued at $248.6 billion in 2016, worth 7.5% of Russian GDP 18Assessment of climate change impacts on buildings, structures and infrastructure in the Russian regions on permafrost · Environmental Research Letters (Streletskiy et al.) ↗. The average estimate for climate-driven permafrost damage to Russian infrastructure by the mid-21st century is $105.07 billion 18, while the pan-Arctic figure runs from $182 billion under SSP2-4.5 to $276 billion under SSP5-8.5 17The costs of Arctic infrastructure damages due to permafrost degradation · Environmental Research Letters (Hjort et al.) ↗.
How many people live on Arctic permafrost, and what is buried in the Batagaika crater?
The Arctic permafrost holds 1,162 settlements housing about 5 million people, and by 2050 the ground below 42 percent of them is expected to thaw, affecting 3.3 million residents 4. At Batagaika, exposed ice may be up to 650,000 years old, and in 2018 the remains of a 42,000-year-old extinct horse foal were found there 15Batagaika Crater, Russia (Earthshots) · U.S. Geological Survey, EROS Center ↗.
References (20)
- 1Frozen Ground & Permafrost — National Snow and Ice Data Center (NSIDC) Web↩View source
- 2Terrestrial Permafrost - Arctic Report Card 2017 — NOAA Arctic Program 2017 Web↩View source
- 3Quick Facts on Frozen Ground — National Snow and Ice Data Center (NSIDC) WebView source
- 4Permafrost — Wikipedia Web↩View source
- 5Science of Frozen Ground — National Snow and Ice Data Center (NSIDC) WebView source
- 6AR6 WG1 Chapter 9: Ocean, Cryosphere and Sea Level Change — IPCC Web↩View source
- 7Permafrost — Encyclopaedia Britannica Web↩View source
- 8Permafrost and the Global Carbon Cycle - Arctic Report Card 2019 — NOAA Arctic Program 2019 Web↩View source
- 9AR6 WG1 Chapter 5: Global Carbon and other Biogeochemical Cycles (Box 5.1) — IPCC Web↩View source
- 10Carbon release through abrupt permafrost thaw — Nature Geoscience (Turetsky et al.) Journal↩View source
- 11Substantial and overlooked greenhouse gas emissions from deep Arctic lake sediment — Nature Geoscience (Jong et al.) JournalView source
- 12Decadal increases in carbon uptake offset by respiratory losses across northern permafrost ecosystems — Nature Climate Change (See et al.) JournalView source
- 1321st-century modeled permafrost carbon emissions accelerated by abrupt thaw beneath lakes — Nature Communications (Walter Anthony et al.) JournalView source
- 14Volumetric quantifications and dynamics of areas undergoing retrogressive thaw slumping in the Northern Hemisphere — Nature Communications Journal↩View source
- 15Batagaika Crater, Russia (Earthshots) — U.S. Geological Survey, EROS Center Web↩View source
- 16Batagaika Crater Expands — NASA Earth Observatory WebView source
- 17The costs of Arctic infrastructure damages due to permafrost degradation — Environmental Research Letters (Hjort et al.) 1748 Journal↩View source
- 18Assessment of climate change impacts on buildings, structures and infrastructure in the Russian regions on permafrost — Environmental Research Letters (Streletskiy et al.) 1748 Journal↩View source
- 19The deep permafrost carbon pool of the Yedoma region in Siberia and Alaska — Geophysical Research Letters (Strauss et al.), via PMC WebView source
- 20Arctic Shifts to a Carbon Source due to Winter Soil Emissions — NASA Goddard Space Flight Center WebView source