Earthquake
The science of earthquakes — plate tectonics and faulting, seismic waves and magnitude scales, the great quakes of history, and how communities prepare for the next one.
An earthquake is the sudden shaking of the ground caused by the passage of seismic waves when energy stored in Earth's crust is released, usually when rock masses strained along a fault suddenly fracture and slip. Most earthquakes occur along the boundaries of tectonic plates — the Circum-Pacific Belt alone releases an estimated 80 percent of the seismic energy — and their size is measured with magnitude scales, from Richter's logarithmic scale of 1934 to the moment magnitude scale used today. Great earthquakes such as Chile in 1960, Alaska in 1964, Sumatra in 2004 and Tohoku in 2011 reshaped both coastlines and seismology, while modern early warning systems like ShakeAlert aim to give seconds of notice before strong shaking arrives.
In this article
- 1Overview
- 2Causes and Fault Mechanics
- 3Plate Tectonics and Global Distribution
- 4Seismic Waves, Location, and Measurement
- 5Magnitude Classes and Energy
- 6Frequency and Detection
- 7Early Warning and Preparedness
- 8Prediction and Research
- 9Historical Earthquakes
- 10Instrumentation History
- 11Timeline: from the first seismoscope to earthquake early warning
- 12Knowledge graph
Overview
An earthquake is any sudden shaking of the ground caused by the passage of seismic waves through Earth's rocks, produced when energy stored in the crust is suddenly released. The shaking originates when stress on a stuck plate edge overcomes friction and energy is released in waves that travel through the crust.
About 50,000 earthquakes large enough to be noticed without the aid of instruments occur annually over the entire Earth, and approximately 100 are of sufficient size to produce substantial damage if their centres are near areas of habitation. The National Earthquake Information Center locates about 12,000 to 14,000 earthquakes each year. Very great earthquakes occur on average about once per year, and over the centuries they have been responsible for millions of deaths and an incalculable amount of damage to property.
1. Causes and Fault Mechanics
An earthquake occurs when two blocks of the earth slip past one another along a surface known as a fault or fault plane. The location below the earth's surface where the earthquake starts is called the hypocenter, and the location directly above it on the surface is called the epicenter. A fault slips when the force of friction along it is overcome.
A fault is a planar or gently curved fracture in crustal rocks where compressional or tensional forces displace the rocks on opposite sides. Normal dip-slip faults are produced by vertical compression as the crust lengthens, with the hanging wall sliding down relative to the footwall; they bound many mountain ranges and the rift valleys along spreading margins of tectonic plates. Reverse dip-slip faults result from horizontal compressional forces, with the hanging wall moving up and over the footwall, and thrust faults are reverse faults that dip less than 45 degrees. Strike-slip faults release energy by horizontal displacement.
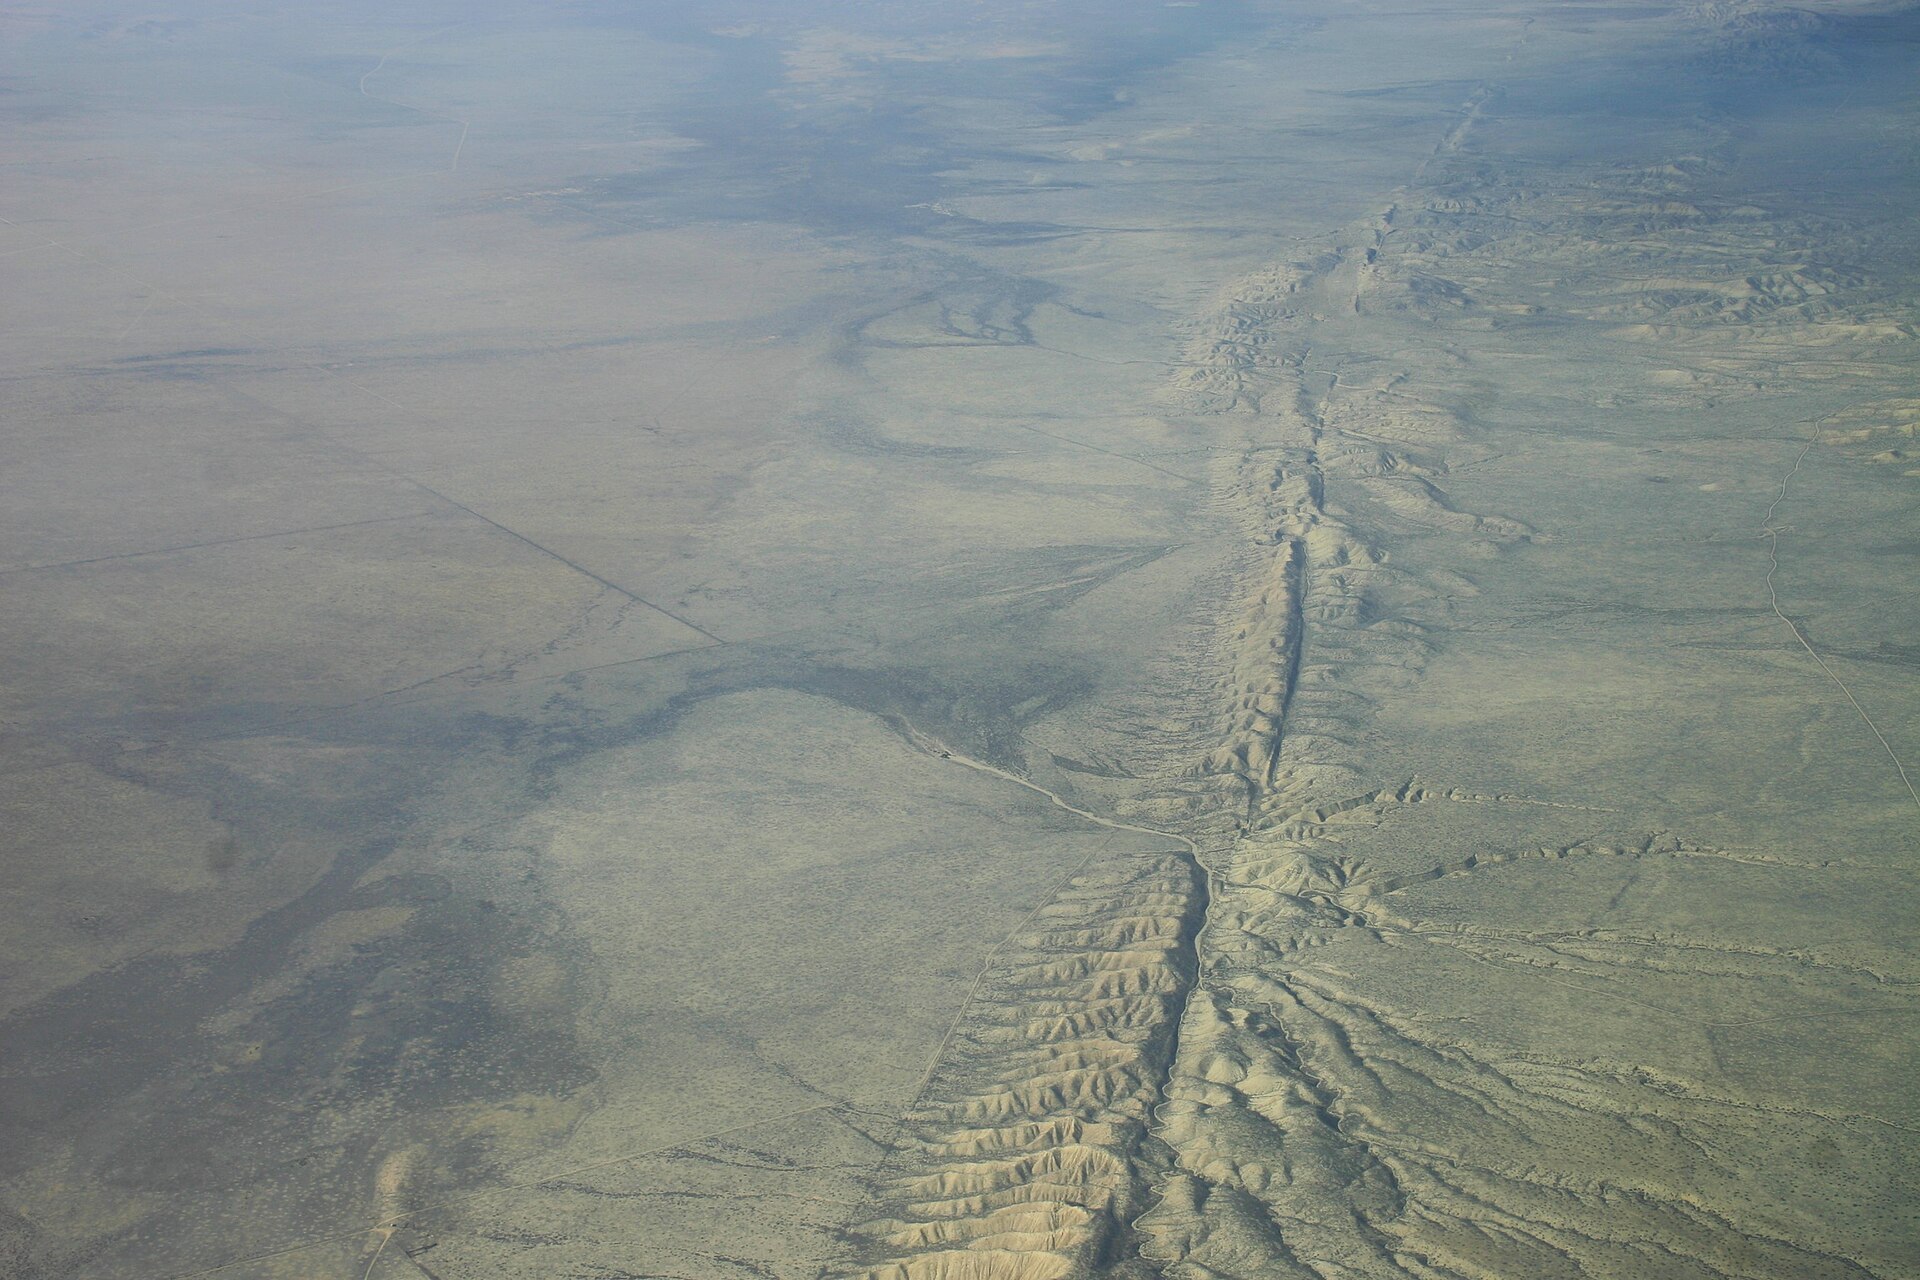
The San Andreas Fault, the primary boundary between the Pacific Plate and the North American Plate, is more than 650 miles long and extends to depths of at least 10 miles. The Pacific Plate grinds northwestward past the North American Plate at a rate of about two inches per year.
2. Plate Tectonics and Global Distribution
The Earth's outermost layer is fragmented into a dozen or more large and small plates that move relative to one another atop hotter, more mobile material. The crust and the top of the mantle together form a thin skin broken into these moving plates.
In 1912 Alfred Wegener introduced the theory of continental drift, contending that around 200 million years ago the supercontinent Pangaea began to split apart. Wegener was intrigued by unusual geologic structures and by identical fossil species found on the matching coastlines of South America and Africa, now separated by the Atlantic Ocean, evidence that the two continents were once joined. Four major scientific developments beginning in the 1950s spurred the theory of plate tectonics, including documentation that earthquake and volcanic activity concentrates along oceanic trenches and submarine mountain ranges.
The global mid-ocean ridge system, more than 50,000 kilometers long and rising an average of about 4,500 meters above the sea floor, is the most prominent topographic feature on the surface of our planet. As seafloor spreading was accepted, scientists came to appreciate the oceanic crust as a natural tape recording of the history of the reversals in the Earth's magnetic field. In 1968 the research vessel Glomar Challenger drilled core samples criss-crossing the Mid-Atlantic Ridge, and dating of the samples provided the clinching evidence that proved the seafloor spreading hypothesis. By the late 1920s seismologists were beginning to identify inclined earthquake zones parallel to ocean trenches, later named Wadati-Benioff zones after Kiyoo Wadati of Japan and Hugo Benioff of the United States.
Major earthquakes occur mainly in belts coinciding with tectonic plate margins, with an estimated 80 percent of presently released seismic energy coming from epicentres in the Circum-Pacific Belt. Because at many places the Circum-Pacific Belt is associated with volcanic activity, it has been popularly dubbed the "Pacific Ring of Fire". A second global belt, the Alpide Belt, passes through the Mediterranean region eastward through Asia and joins the Circum-Pacific Belt in the East Indies, releasing about 15 percent of the world total energy.
3. Seismic Waves, Location, and Measurement
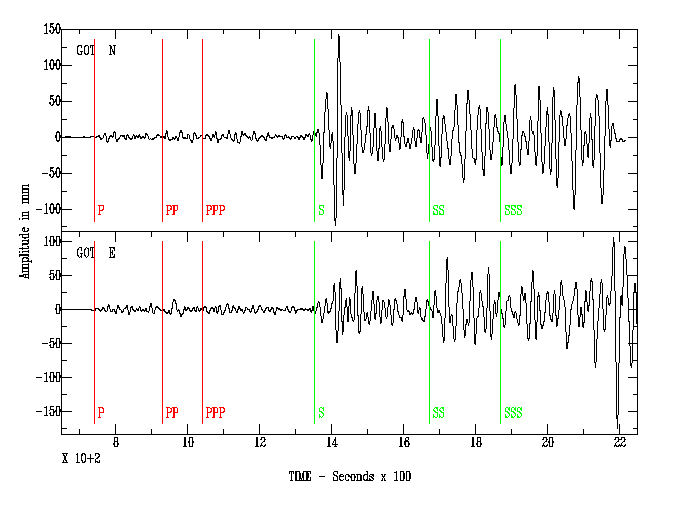
A seismometer records the ground shaking caused by seismic waves, while the term seismograph refers to the combined instrument and recording device. On the resulting record, a short wiggle means a small earthquake and a long, large wiggle means a large one.
On a seismogram the P wave is the first wiggle bigger than background signals, the S waves follow and are usually bigger, and the surface Love and Rayleigh waves travel slower still and arrive just after the S waves. Because P waves travel faster than S waves, the time between their arrivals indicates distance to the earthquake but not direction; locating an earthquake requires three seismographs, with circles drawn around each station at its distance intersecting at the epicenter. In one worked example, a 24-second P–S separation indicated an epicenter 215 kilometers away.
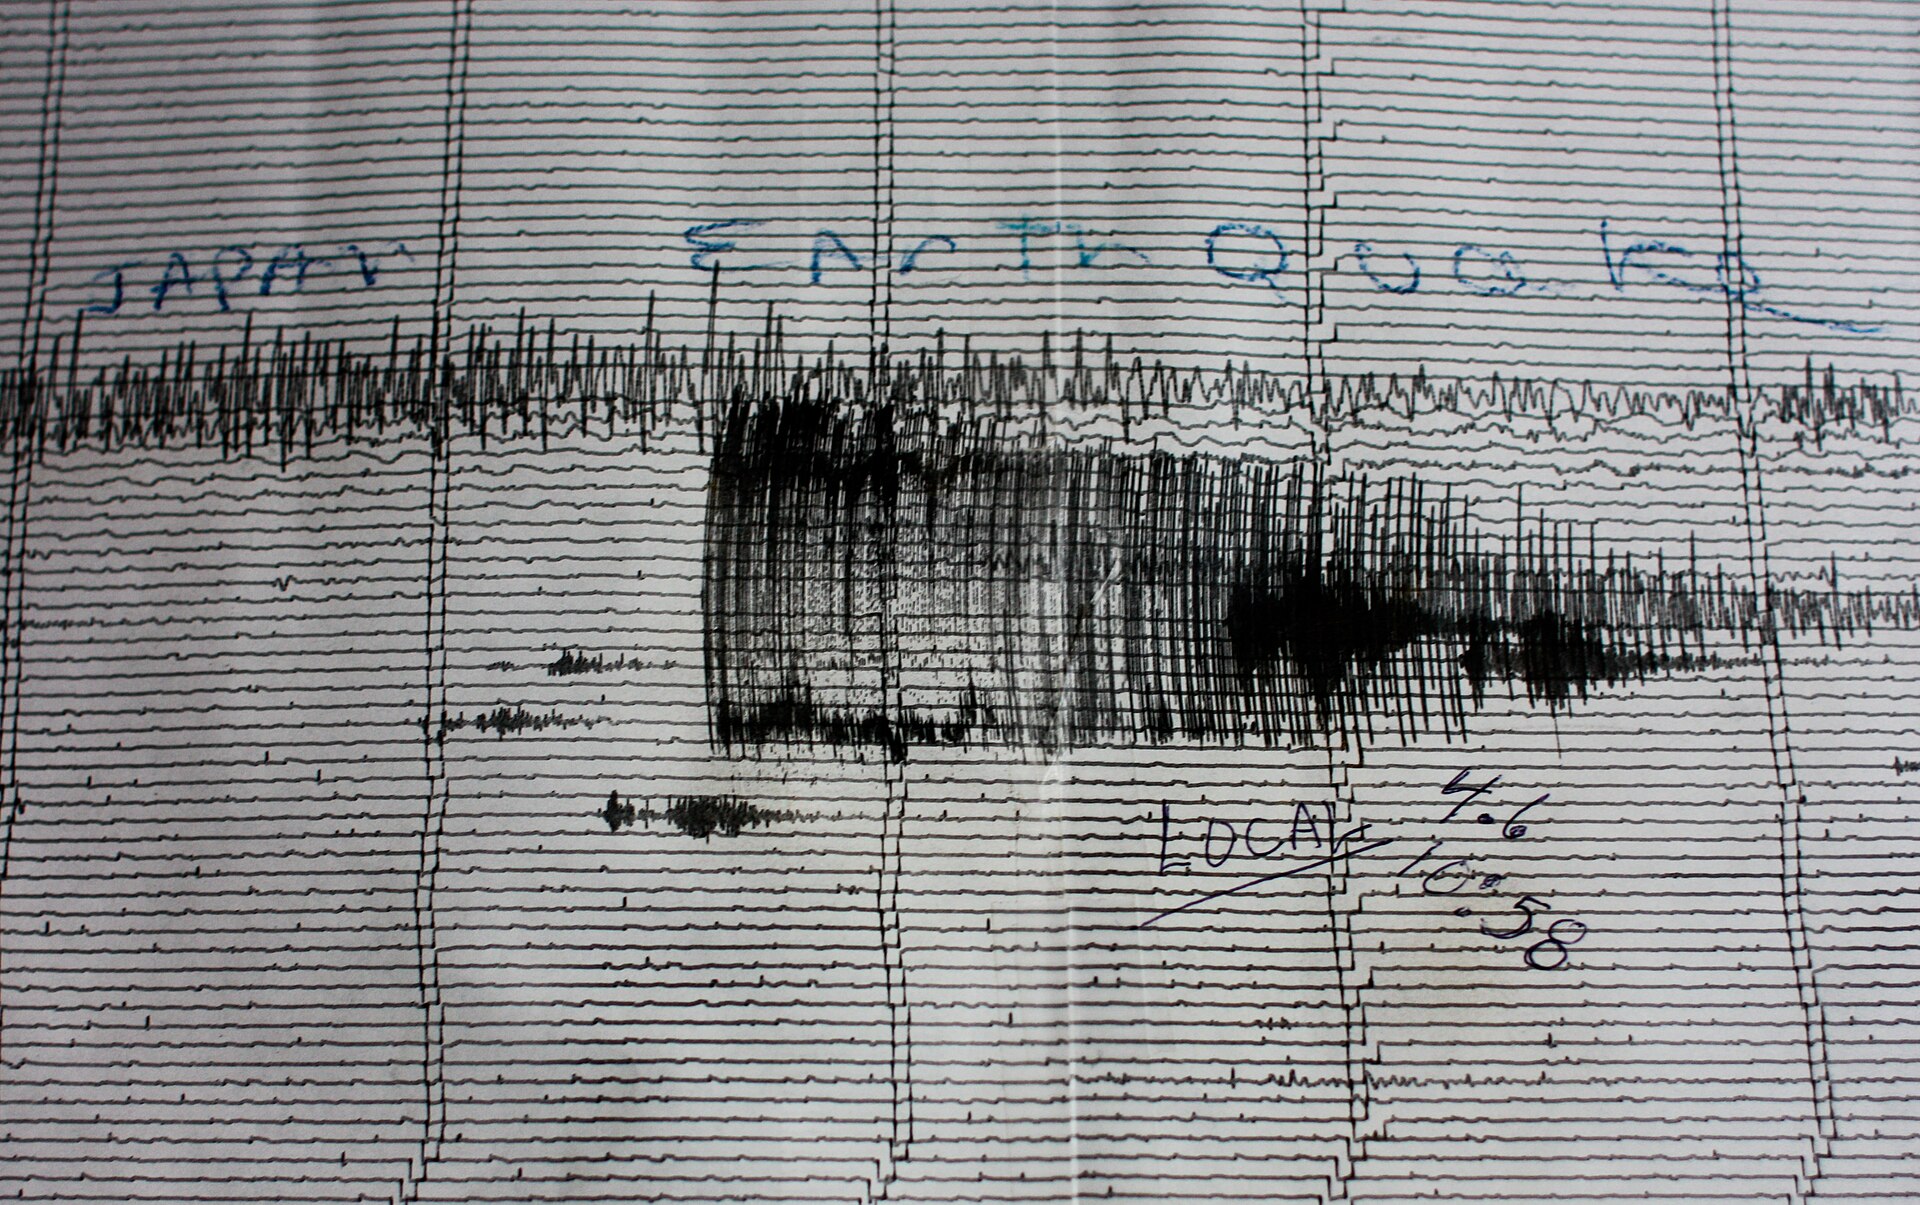
Magnitude is a single value for the size of an earthquake, while shaking intensity varies by location.
Scientists no longer use the Richter scale; instead they use a number of different scales depending on what kind of motion they want to detect, and the one usually reported to the public is the local magnitude. Magnitudes can be based on seismic moment estimates, teleseismic body-wave amplitudes, surface waves, local recordings, or signal duration. The Richter scale, the first widely used method, was developed by Charles F. Richter in 1934 and used a formula based on the amplitude of the largest wave recorded on a specific type of seismometer. Today the moment magnitude scale, abbreviated MW, is preferred because it works over a wider range of earthquake sizes and is applicable globally.
The original intensity scale was invented by Giuseppe Mercalli in 1902 and modified by Harry Wood and Frank Neumann in 1931 to become the Modified Mercalli Intensity Scale, which uses roman numerals.
4. Magnitude Classes and Energy
The energy released does not rise at the same rate as the recorded amplitude: for every step up in magnitude, the annual number of earthquakes falls by roughly a factor of ten 3How Often Do Earthquakes Occur? · NSF SAGE / EarthScope Consortium ↗.
| Class | Magnitude range |
|---|---|
| Great | M8 and above |
| Major | 7.0 to 7.9 |
| Strong | 6.0 to 6.9 |
Under the standard magnitude classes, a great earthquake is one of magnitude 8 or greater, while a major earthquake falls in the range of magnitude 7 to 7.9 12How do I interpret magnitudes and magnitude types? · NSF SAGE / EarthScope Consortium (IRIS Data Services FAQ) ↗.
Earthquake magnitude is expressed on a logarithmic scale with a base of ten, so that each whole-number step corresponds to a tenfold increase in the amplitude of ground motion recorded by a seismograph 11How Do We Measure Earthquake Magnitude? · Michigan Technological University (UPSeis) ↗. Each whole-number increase on the Richter scale corresponds to a 31.6-fold rise in released energy 10What does the Richter scale tell us about energy released by an earthquake? · NSF SAGE / EarthScope Consortium ↗.
5. Frequency and Detection
Earth is an active place, and earthquakes are always happening somewhere. That more earthquakes can be detected and located each year does not mean that the annual average number of earthquakes has increased.
Mainshocks always have aftershocks, which are smaller earthquakes occurring afterwards in the same place. These aftershocks can continue for weeks, months, and even years.
6. Early Warning and Preparedness
It is not earthquake prediction; rather, it is a tool indicating that shaking is imminent.
During an earthquake, if you are inside, stay there and do not run outside. If you are in bed, turn face down and cover your head and neck. If you are in a car, pull over and stop; if you are outside, move to an open area away from buildings, trees, streetlights and power lines.
7. Prediction and Research
Scientists cannot predict earthquakes, and it is unlikely that they ever will. On any fault, another earthquake will happen sometime, but there is no way of telling when.
NASA's geosphere research studies the processes and changes in the Earth's core, mantle, and crust, along with surface topography, composition, and geology, and the hazards they generate. NASA's Crustal Dynamics research informs the assessment, mitigation, and forecasting of natural hazards, including earthquakes, tsunamis, landslides, and volcanic eruptions.
8. Historical Earthquakes
-
1 November 1755Lisbon earthquakeA series of earthquakes struck Lisbon on the morning of All Saints' Day, killing an estimated 60,000 people in the city alone, and the shock, tsunami and fires made it a seminal event in European history.16Lisbon earthquake of 1755 | Great Lisbon Quake, Tsunami & Fire · Encyclopaedia Britannica ↗
-
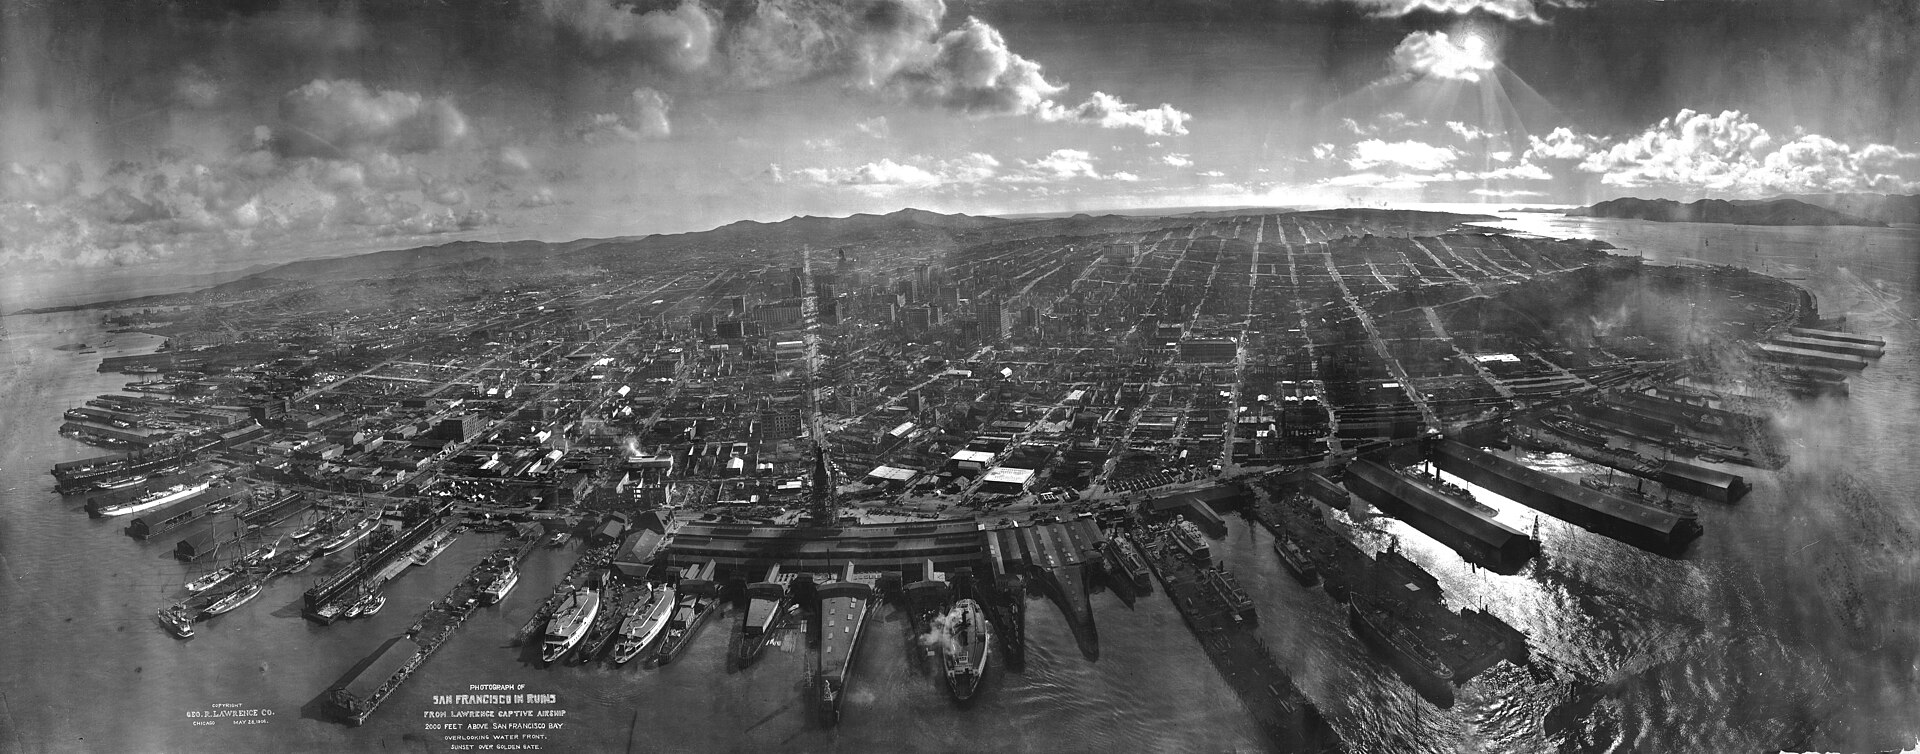
18 April 1906Northern California earthquakeThe magnitude 7.9 earthquake was the most damaging in US history. The 1906 rupture on the San Andreas fault was traced 202 miles (325 km) to the northwest and 93 miles (241 km) to the southeast, and strong shaking was felt in the Bay Area for 45 to 60 seconds.17A Virtual Tour of the 1906 Earthquake in Google Earth · U.S. Geological Survey (USGS) ↗
-
1 September 1923Tokyo-Yokohama (Great Kanto) earthquakeA magnitude 7.9 earthquake struck the Tokyo-Yokohama metropolitan area near noon on 1 September, and the death toll was estimated to have exceeded 140,000 people as fires consumed hundreds of thousands of houses.18Tokyo-Yokohama earthquake of 1923 | Death Toll & Facts · Encyclopaedia Britannica ↗
-
22 May 1960Chile earthquakeIts magnitude of 9.5 makes the 1960 Chile earthquake the largest recorded in the 20th century; the rupture extended over an estimated 900 to 1,000 km of the Nazca Plate off southern Chile and sent a tsunami across the Pacific. Most casualties resulted from a tsunami that rose up to 80 feet (25 metres) high along the Chilean coastline.19Chile earthquake of 1960 | Causes, Effects, & Facts · Encyclopaedia Britannica ↗
-
27 March 1964Alaska earthquakeA magnitude 9.2 earthquake in Prince William Sound, the most powerful recorded in U.S. history, lasted about 4.5 minutes and later proved key to the developing theory of plate tectonics.20M9.2 Alaska Earthquake and Tsunami of March 27, 1964 · U.S. Geological Survey (USGS) ↗
-
26 December 2004Sumatra-Andaman earthquake and Indian Ocean tsunamiA magnitude 9.1 megathrust earthquake off Sumatra ruptured the subduction zone where the India Plate, an oceanic plate, is being subducted beneath the Burma micro-plate, and it generated a devastating ocean-wide tsunami.21Tsunami Generation from the 2004 M=9.1 Sumatra-Andaman Earthquake · U.S. Geological Survey, Pacific Coastal and Marine Science Center ↗
-
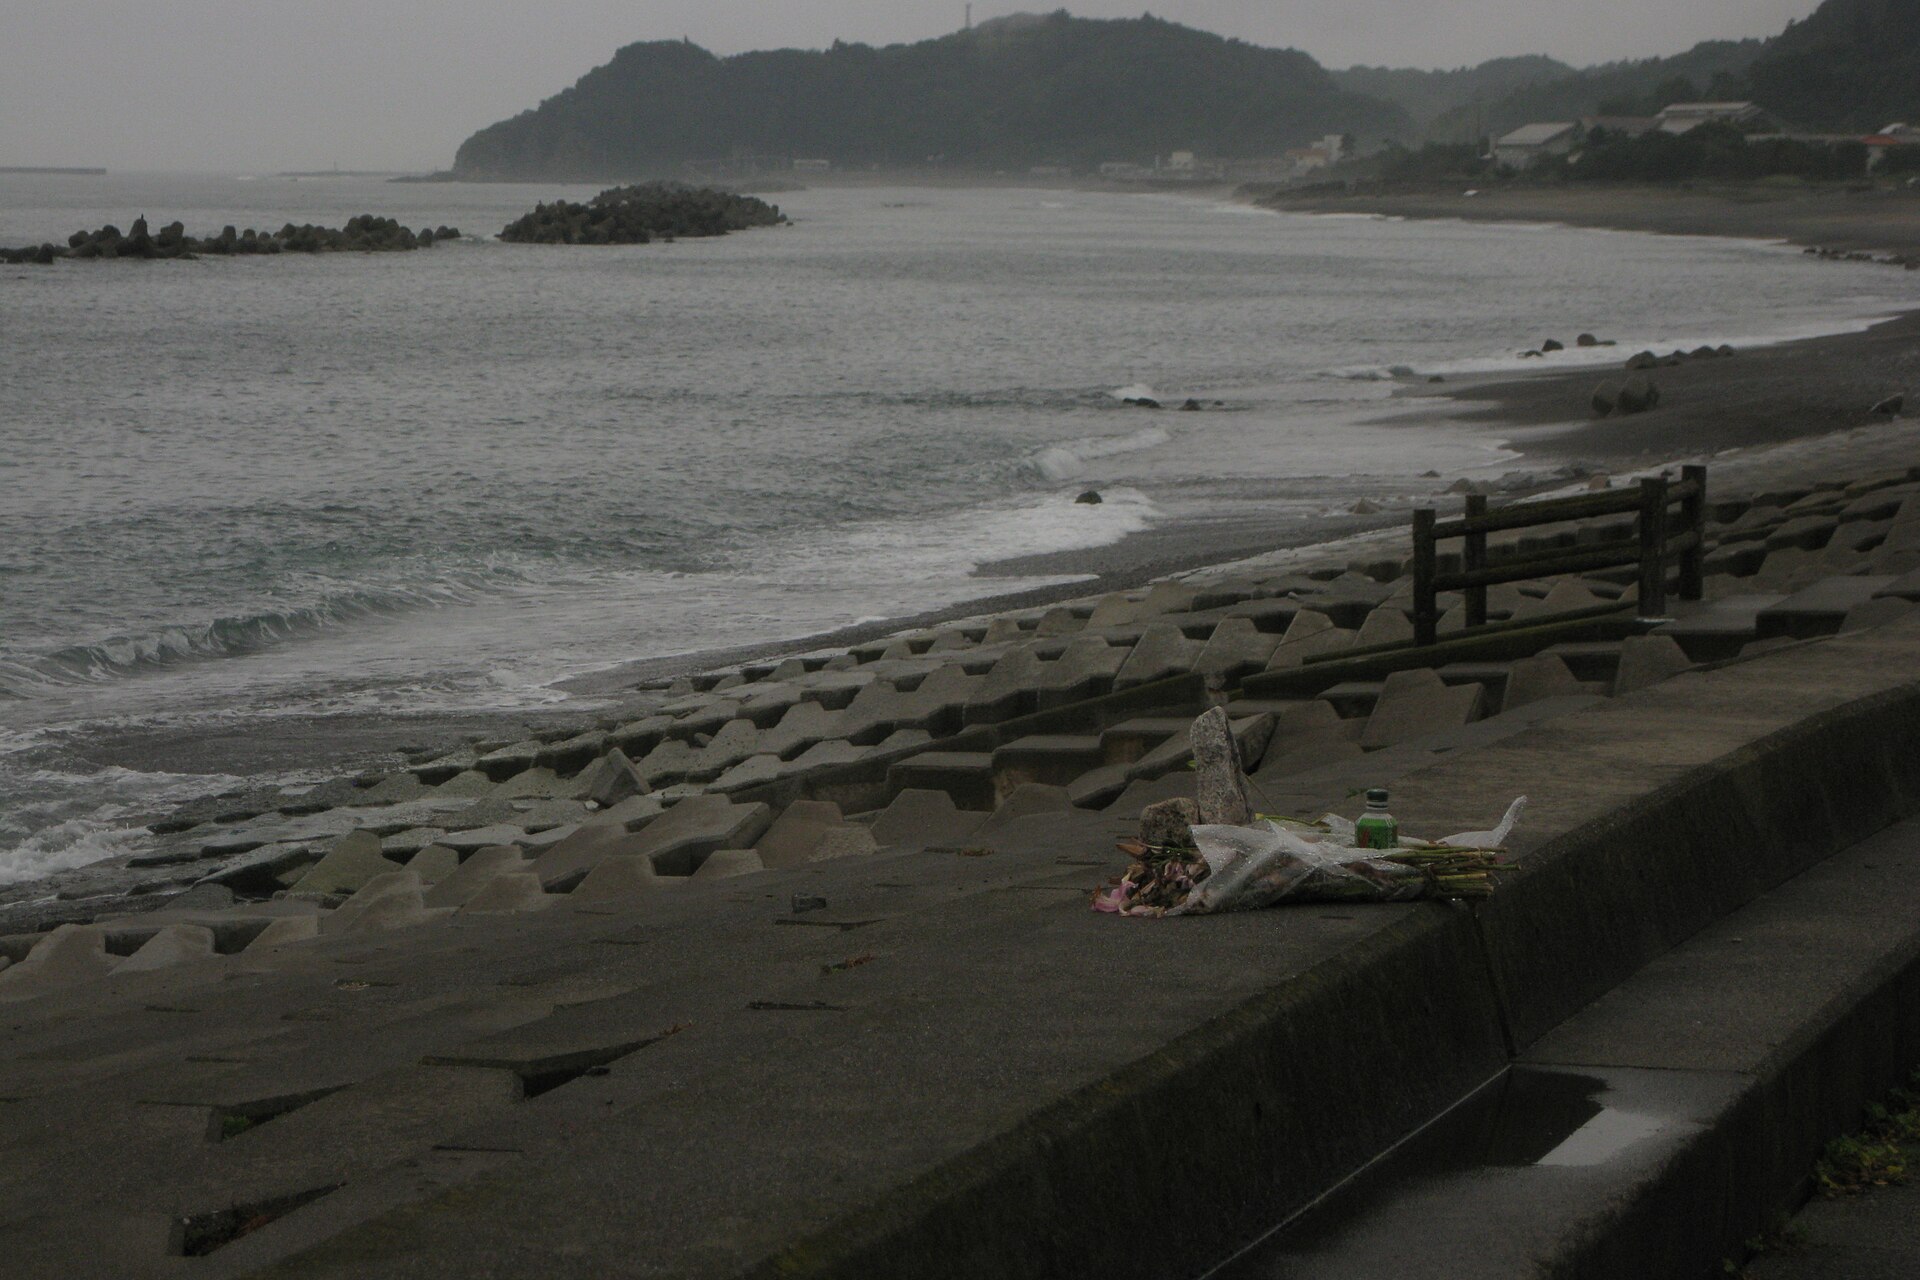
11 March 2011Tohoku earthquake and tsunamiA magnitude 9.0 earthquake occurred near the east coast of Honshu, Japan on 11 March 2011 as a result of thrust faulting on or near the subduction zone interface plate boundary between the Pacific and North American plates. Its focus lay at a depth of 24.4 km, about 130 km east of Sendai, and it generated a tsunami warning across the Pacific.22Special Event: Tohoku, Japan earthquake · NSF SAGE / EarthScope Consortium ↗
9. Instrumentation History
The earliest seismoscope was invented by the Chinese philosopher Chang Heng in A.D. It took the form of a large urn on whose outside were eight dragon heads facing the eight principal directions of the compass. When an earthquake occurred, one of the dragon mouths would release a ball into the open mouth of a toad below, and the instrument is reported to have detected an earthquake 400 miles away that was not felt at its location.
10. Timeline: from the first seismoscope to earthquake early warning
- A.D. 132The first seismoscopeThe Chinese philosopher Chang Heng invented the earliest seismoscope, a large urn with eight dragon heads that released balls to indicate the direction of a distant earthquake.
- 1 November 1755Lisbon earthquakeA series of earthquakes struck Lisbon on the morning of All Saints' Day, killing an estimated 60,000 people in the city alone. The shock, tsunami and fires made it a seminal event in European history.
- 18 April 1906San Francisco earthquakeThe magnitude 7.9 Northern California earthquake, the most damaging in US history, revealed the existence and significance of the San Andreas fault and helped give birth to the science of earthquakes.
- 1 September 1923Tokyo-Yokohama (Great Kanto) earthquakeA magnitude 7.9 earthquake struck the Tokyo-Yokohama metropolitan area near noon; the death toll exceeded 140,000 as fires consumed hundreds of thousands of houses.
- 1934Richter scale developedCharles F. Richter developed the first widely-used earthquake magnitude scale, based on the amplitude of the largest wave recorded on a specific type of seismometer.
- 22 May 1960Chile earthquakeThe largest earthquake recorded in the 20th century, magnitude 9.5, ruptured a 900 to 1,000 km stretch of the Nazca Plate off southern Chile and sent a tsunami across the Pacific.
- 27 March 1964Alaska earthquakeA magnitude 9.2 earthquake in Prince William Sound, the most powerful in U.S. history, lasted about 4.5 minutes and later proved key to the developing theory of plate tectonics.
- 1968Glomar Challenger drilling expeditionThe research vessel Glomar Challenger drilled core samples along the Mid-Atlantic Ridge, and dating of the samples provided the clinching evidence for seafloor spreading.
- 1989Loma Prieta earthquakeOne of the most destructive earthquake disasters in U.S. history struck northern California; its anniversary decades later framed the development of the ShakeAlert early warning system.
- 26 December 2004Sumatra-Andaman earthquake and Indian Ocean tsunamiA magnitude 9.1 megathrust earthquake off Sumatra ruptured the subduction zone where the India Plate descends beneath the Burma micro-plate and generated a devastating ocean-wide tsunami.
- January 2010Haiti earthquakeA magnitude 7.0 earthquake struck the Port-au-Prince region of Haiti, leaving residents of damaged neighbourhoods seeking safety in open ground.
- 11 March 2011Tohoku earthquake and tsunamiA magnitude 9.0 earthquake near the east coast of Honshu, Japan resulted from thrust faulting on the subduction zone plate boundary and generated a tsunami warning across the Pacific.
- 2017ShakeAlert released to select technical usersAfter incorporating feedback from early adopters, the USGS made ShakeAlerts available to select technical users throughout the West Coast.
- early 2019Los Angeles ShakeAlert pilot appThe next phase of ShakeAlert testing was limited public alerting in Los Angeles County using a cellphone app developed by the City of Los Angeles.
References (23)
- 1What is an earthquake and what causes them to happen? — U.S. Geological Survey (USGS) WebView source
- 2Earthquake | Definition, Causes, Effects, & Facts — Encyclopaedia Britannica WebView source
- 3How Often Do Earthquakes Occur? — NSF SAGE / EarthScope Consortium Web↩View source
- 4The Science of Earthquakes — U.S. Geological Survey WebView source
- 5Earthquake Magnitude and Intensity — NSF SAGE / EarthScope Consortium WebView source
- 6Fault | Definition & Types — Encyclopaedia Britannica WebView source
- 7This Dynamic Earth: Historical perspective — U.S. Geological Survey (USGS) WebView source
- 8This Dynamic Earth: Developing the theory — U.S. Geological Survey (USGS) WebView source
- 9How Are Earthquakes Studied? — Michigan Technological University (UPSeis) WebView source
- 10What does the Richter scale tell us about energy released by an earthquake? — NSF SAGE / EarthScope Consortium Web↩View source
- 11How Do We Measure Earthquake Magnitude? — Michigan Technological University (UPSeis) Web↩View source
- 12How do I interpret magnitudes and magnitude types? — NSF SAGE / EarthScope Consortium (IRIS Data Services FAQ) Web↩View source
- 13USGS ShakeAlert Earthquake Early Warning System — U.S. Geological Survey (USGS) WebView source
- 14Earthquakes — Ready.gov (FEMA) WebView source
- 15Geosphere — NASA Science WebView source
- 16Lisbon earthquake of 1755 | Great Lisbon Quake, Tsunami & Fire — Encyclopaedia Britannica 1755 Web↩View source
- 17A Virtual Tour of the 1906 Earthquake in Google Earth — U.S. Geological Survey (USGS) 1906 Web↩View source
- 18Tokyo-Yokohama earthquake of 1923 | Death Toll & Facts — Encyclopaedia Britannica 1923 Web↩View source
- 19Chile earthquake of 1960 | Causes, Effects, & Facts — Encyclopaedia Britannica 1960 Web↩View source
- 20M9.2 Alaska Earthquake and Tsunami of March 27, 1964 — U.S. Geological Survey (USGS) 1964 Web↩View source
- 21Tsunami Generation from the 2004 M=9.1 Sumatra-Andaman Earthquake — U.S. Geological Survey, Pacific Coastal and Marine Science Center 2004 Web↩View source
- 22Special Event: Tohoku, Japan earthquake — NSF SAGE / EarthScope Consortium 2011 Web↩View source
- 23What was the first instrument that actually recorded an earthquake? — U.S. Geological Survey (USGS) WebView source