Hurricane
The science and history of the hurricane: how tropical cyclones form over warm oceans, the eye, eyewall and rainbands, the Saffir-Simpson wind scale, naming and retirement, storm surge and forecasting, and the storms from Galveston in 1900 and Katrina in 2005 to Maria and a warming Atlantic.
A hurricane is a warm-core tropical cyclone with a closed circulation and sustained winds of at least 74 mph, born over ocean water of about 27 degrees Celsius and steered westward by easterly waves before it curves poleward. Its structure is a calm eye inside a ring of violent eyewall thunderstorms, wrapped by spiral rainbands, and its deadliest hazard is usually water rather than wind: storm surge, then inland rainfall flooding, kill far more people than the wind itself. The Saffir-Simpson scale rates storms from 1 to 5 by wind alone, while six rotating name lists, maintained by the World Meteorological Organization, are edited only when a name is retired for a catastrophe. The National Hurricane Center forecasts these storms with satellites, aircraft reconnaissance and numerical models, and the historical record from Galveston in 1900 through Katrina in 2005 and Maria in 2017 shows how much of the toll is decided by exposure, levees and warning time.
Overview
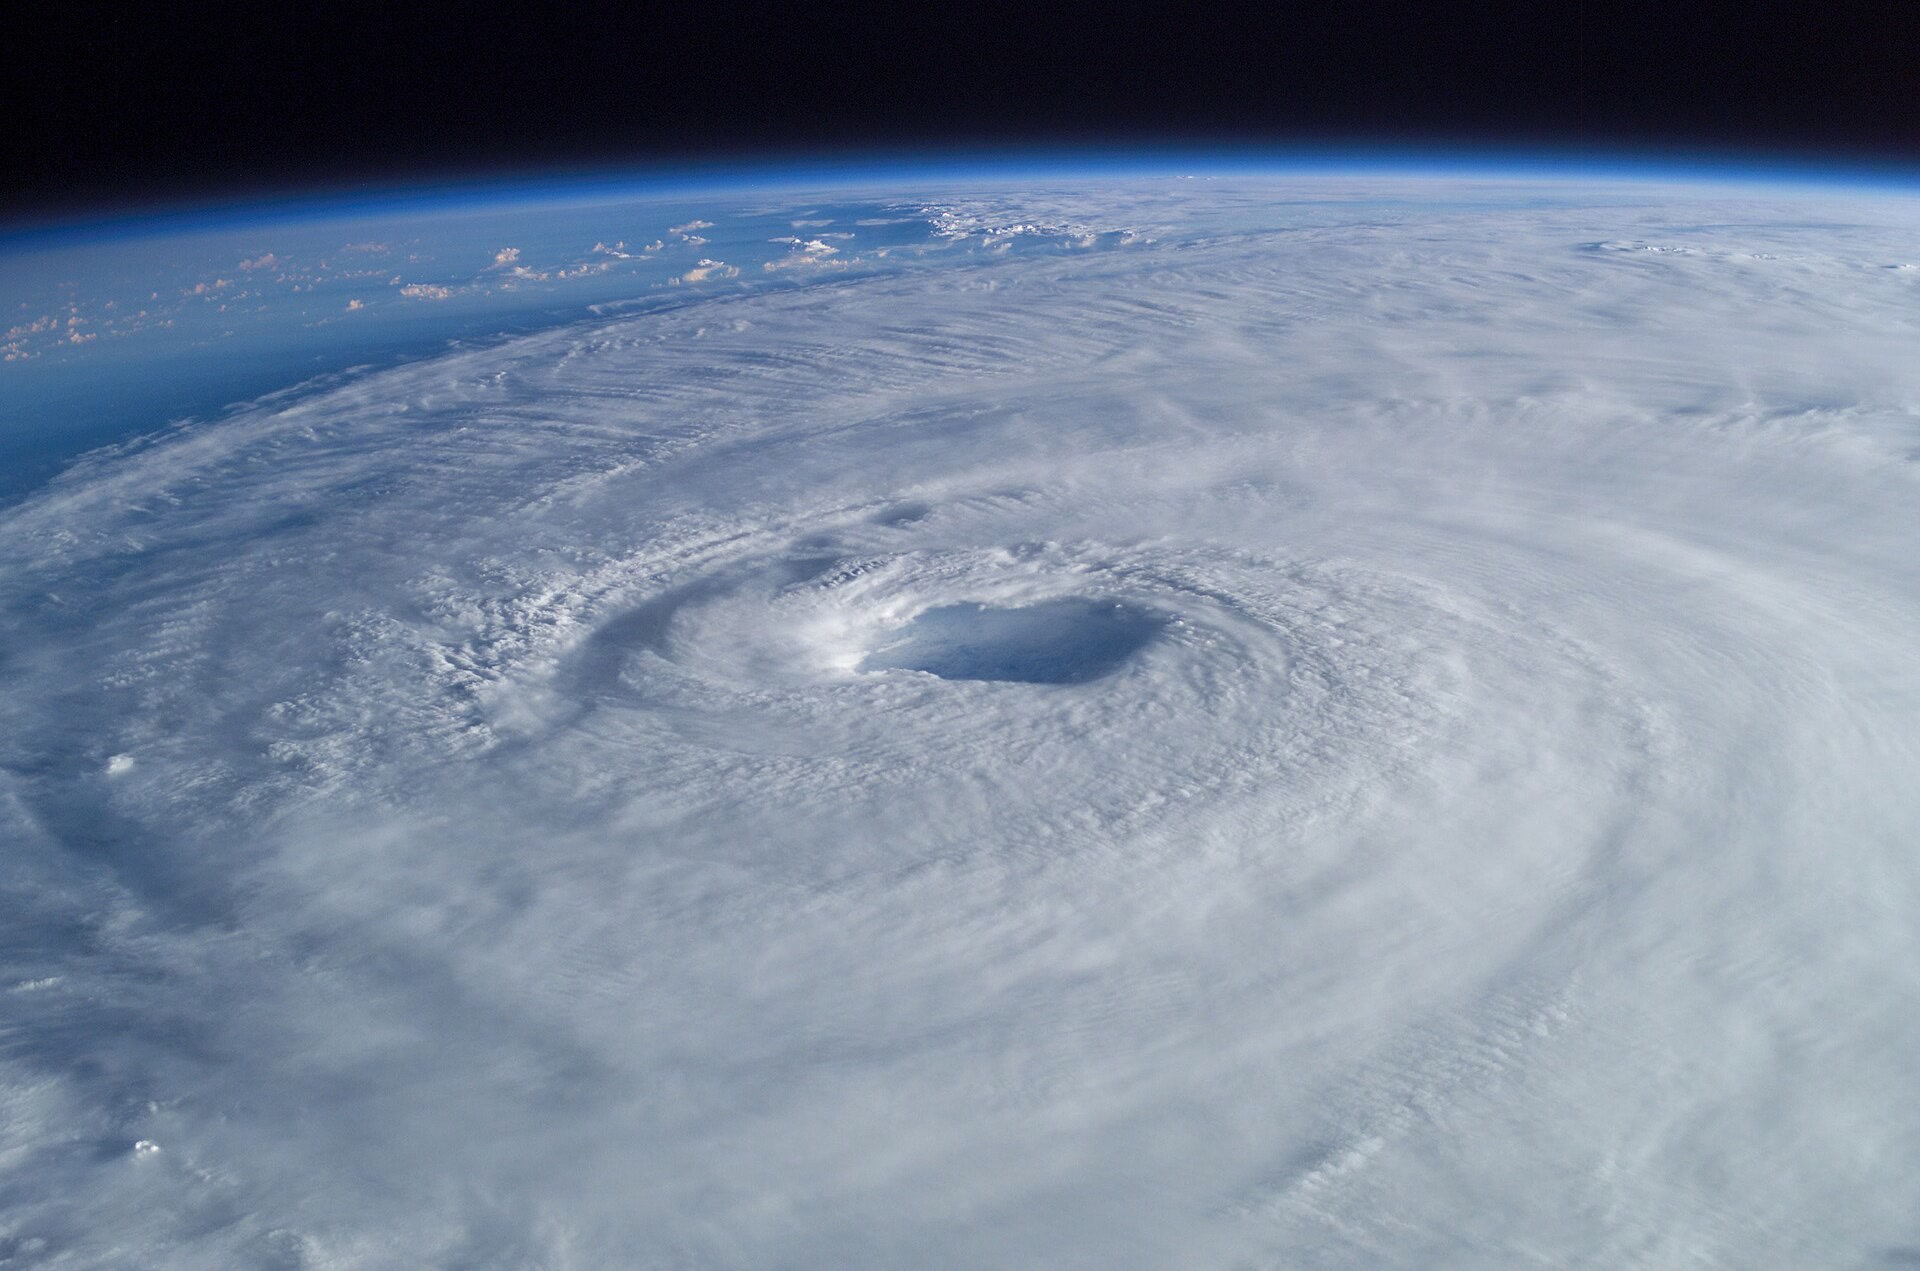
A hurricane is a warm-core tropical cyclone with a closed circulation, no front attached and sustained winds of at least 74 mph (64 knots). It is a rapidly rotating storm that begins over tropical oceans and varies in speed, size and intensity. Mature tropical cyclones can span 300 to 500 miles and stand five to six miles high.
1. Formation and Structure
A hurricane draws its energy from warm ocean water, requiring a sea surface of at least 27 degrees Celsius down to a depth of about 150 feet. Other influences being equal, warmer waters yield stronger hurricanes with heavier rainfall. Most Atlantic hurricanes can be traced to easterly waves that form over western Africa, and the Intertropical Convergence Zone is where the trade winds meet and trigger daily thunderstorms. The Coriolis effect makes storms rotate counterclockwise in the Northern Hemisphere and clockwise in the south.
The eye is a calm, generally clear area of sinking air typically 20 to 40 miles across. In intense storms an outer ring of thunderstorms can form and rob the inner eyewall of moisture and momentum. Such concentric eyewall cycles occur naturally in intense tropical cyclones of Category 3 and above. When the outer eyewall replaces the inner one the storm can return to its former intensity or even strengthen. Hurricane Andrew went through a concentric eyewall cycle before landfall near Miami, and an eyewall replacement before Puerto Rico tripled Maria's eye diameter from 9 to about 28 nautical miles.
Hurricanes form over tropical waters between 8 and 20 degrees latitude. Formation requires a minimum distance of 300 miles (480 km), or about 5 degrees of latitude, from the equator, because the Coriolis force there is too weak to set the storm spinning.
2. Intensity Scales and Classification
The Saffir-Simpson Hurricane Wind Scale rates hurricanes from 1 to 5 using only their maximum sustained wind speed. The scale was devised in the early 1970s by engineer Herbert Saffir and NHC director Robert Simpson. Because it is built on wind alone the scale leaves out storm surge, rainfall flooding and tornadoes even though those hazards are also deadly.
The primary hazards of a hurricane are surge flooding, inland rain flooding, destructive winds, tornadoes and rip currents.
The Storm Surge Unit forecasts abnormal sea-level rise with the SLOSH computer model.
A storm becomes a major hurricane at 111 mph (96 knots), which is Category 3 on the scale.
3. Seasonal Cycle and Climatology
Atlantic hurricane activity reaches its peak on September 10 and most storms form between mid-August and mid-October.
The Atlantic hurricane season officially runs from June 1 to November 30 each year. A typical season in the 1991-2020 era produced 14 named storms, 7 hurricanes and 3 major hurricanes.
4. Naming
Atlantic tropical storms have been named from lists originated by the National Hurricane Center since 1953 and those lists remain in use. In 1953 United States weather services began using female names for tropical storms. Six name lists are maintained by the World Meteorological Organization, used in rotation and recycled every six years, so the 2026 list returns in 2032.
A name is retired only when a storm is so deadly or costly that reusing it for another storm would be insensitive. If more than twenty-one named storms occur in an Atlantic season, further storms take names from an approved alternate list.
Storms of hurricane strength are called typhoons in the western North Pacific and cyclones in the Indian and South Pacific oceans. For centuries many West Indies hurricanes were named after the saint's day on which they struck, and in 1979 male and female names were both included in the Atlantic and Gulf of Mexico lists.
In 2020 the Greek alphabet was retired in favour of a supplemental list after forecasters found it confusing.
The letters Q, U, X, Y and Z are omitted from the lists because few names begin with them and they translate poorly.
5. Hazards
Storm surge is an abnormal rise of water above the predicted tide, driven mainly by onshore winds, and its height is sensitive to storm intensity, forward speed, size, angle of approach and the shape of the coastline. Surge is the leading coastal killer, with rain flooding second. Most coastal hurricane damage is typically flooding caused by storm surge and rainfall rather than by wind alone.
Tropical cyclones rank as the second-most dangerous natural hazard in the world after earthquakes. Over the past 50 years 1,945 disasters were attributed to tropical cyclones, which killed 779,324 people and caused US$1.4 trillion in losses.
6. Notable Storms
Puerto Rico's government estimated 2,975 fatalities on the island from Maria, counting direct and indirect deaths. Maria knocked down 80 percent of Puerto Rico's utility poles and cut power to essentially all 3.4 million residents. Maria reached peak intensity of 150 knots with a minimum pressure of 908 mb.
The revised death toll in the National Hurricane Center's 2023 Katrina report is 1,392, with 520 direct and 565 indirect deaths, while the National Weather Service office in Mobile records 1,833 fatalities and about 108 billion dollars in damage.
Katrina was the costliest hurricane ever to strike the United States and one of the five deadliest.
Katrina's maximum storm surge reached 27.8 feet at Pass Christian across a swath roughly 20 miles wide. The National Hurricane Center's revised report puts Katrina's damage at 125 billion dollars in 2005 dollars.
Galveston in 1900 was a city of 38,000 inhabitants when a storm wave swamped the island; between 6,000 and 8,000 people died in the city and island casualties were estimated at 10,000 to 12,000. A high-water mark of 15.7 feet and high winds destroyed 2,636 houses and a third of the city, and Galveston afterwards built a six-mile seawall standing seventeen feet above mean low tide.
The Labor Day hurricane of 1935 struck the Florida Keys with a central pressure of 892 mb, still the lowest on record for a United States landfall, and Camille reached the Gulf coast in 1969 at 900 mb, the second lowest.
Wilma deepened to 882 mb with sustained winds of 184 mph in October 2005, the strongest Atlantic hurricane on record.
Hurricane Allen went through repeated eyewall replacement cycles in 1980, and Andrew weakened during a concentric eyewall cycle in 1992 before reintensifying ahead of landfall near Miami. Mitch stalled over Central America in 1998 and became one of the most destructive storms of the twentieth century, while storm surge from Ian killed 41 people in Florida in 2022 and showed how the hazard reaches far inland.
7. Observation, Forecasting and Warning
The National Hurricane Center frames its work around a single purpose: to save lives and mitigate property loss through the best forecasts and warnings it can produce. Within that institution the Hurricane Specialist Unit maintains a continuous watch on tropical cyclones across the North Atlantic and the eastern North Pacific.
NOAA's WP-3D Orion aircraft fly 8 to 10 hour missions through the eyewall and eye of hurricanes, and GPS dropwindsondes transmit pressure, humidity, temperature and wind measurements as they fall toward the sea.The G-IV jet cruises at 45,000 feet with a range of 4,000 nautical miles around developing storms.
GOES satellites orbit 22,236 miles above the equator at speeds matching Earth's rotation. The GOES-R imager provides images of hurricanes and severe storms as often as every 30 seconds.
The CARCAH unit coordinates all tropical cyclone reconnaissance requirements for the National Hurricane Center.
8. Climate Change and Hurricanes
Most models agree that climate change will increase the average intensity and rainfall rates of hurricanes. Atlantic hurricane activity has increased since the 1970s but the record is too short to separate natural and human causes.
Global tropical cyclone intensities are projected to rise by 1 to 10 percent for 2 degrees Celsius of warming. Models project about a 14 percent rise in rainfall rates near storms for 2 degrees Celsius of global warming, with a range of +6 to +22 percent.
The share of tropical cyclones reaching Category 4 or 5 is projected to increase over the 21st century. Sea-level rise will increase the threat of storm surge flooding during hurricanes regardless of any human change in storm frequency or intensity.
9. Timeline: from Galveston to the satellite era
- 8 September 1900The Galveston hurricaneA storm wave swamped Galveston Island, killing between 6,000 and 8,000 people in the city and an estimated 10,000 to 12,000 across the island.
- 2 September 1935The Labor Day hurricaneThe Labor Day hurricane struck the Florida Keys with a central pressure of 892 mb, still the lowest on record for a United States landfall.
- 1953Atlantic storms get namesUnited States weather services began using female names for storms in 1953 after a phonetic alphabet proved confusing.
- 17 August 1969Camille sets a pressure recordHurricane Camille reached the Gulf coast with a central pressure of 900 mb, the second lowest on record for a United States landfall behind the 1935 Labor Day hurricane.
- early 1970sThe Saffir-Simpson scaleHerbert Saffir and Robert Simpson devised a five-category wind scale that the National Hurricane Center still uses.
- 1979Men's names join the listsMale and female names were both used in Atlantic and Gulf of Mexico storm lists for the first time.
- 1980Allen cycles through eyewallsHurricane Allen went through repeated eyewall replacement cycles, swinging between Category 5 and Category 3 several times.
- August 1992Andrew and the eyewall cycleHurricane Andrew weakened during a concentric eyewall cycle and then reintensified before landfall near Miami.
- 1997The G-IV joins the huntNOAA's Gulfstream IV began flying around Atlantic hurricanes, mapping the steering currents that decide where a storm goes.
- October 1998Mitch stalls over Central AmericaHurricane Mitch soaked Nicaragua and Honduras and became one of the most destructive storms of the twentieth century.
- 29 August 2005Katrina and the New Orleans leveesKatrina weakened to Category 3 at landfall but its surge breached levees and flooded most of New Orleans, causing 1,392 deaths and 125 billion dollars in damage.
- 19 October 2005Wilma sets the Atlantic pressure recordHurricane Wilma deepened to 882 mb with sustained winds of 184 mph, the strongest Atlantic hurricane on record.
- 20 September 2017Maria devastates Puerto RicoMaria hit Dominica at Category 5 strength and Puerto Rico as a high-end Category 4 storm, causing catastrophic damage and a revised death toll of 2,975 on the island.
- 2020The Greek alphabet is retiredThe Greek alphabet was retired in favour of a supplemental list after forecasters found it confusing.
- September 2022Ian and the surge tollStorm surge from Hurricane Ian killed 41 people in Florida and showed how the hazard reaches far inland.
References (22)
- 1Tropical Cyclone Introduction — NOAA JetStream WebView source
- 2What are hurricanes? — Met Office WebView source
- 3Tropical cyclone — World Meteorological Organization WebView source
- 4Could climate change make Atlantic hurricanes worse? — NOAA Climate.gov WebView source
- 5Hurricanes: The Greatest Storms on Earth — NASA Science WebView source
- 6Hurricanes — UCAR Center for Science Education WebView source
- 7Tropical Cyclone Structure — NOAA JetStream WebView source
- 8What are concentric eyewall cycles? — NOAA Atlantic Oceanographic and Meteorological Laboratory WebView source
- 9Tropical Cyclone Report: Hurricane Maria, 16-30 September 2017 — NOAA National Hurricane Center 2017 WebView source
- 10Saffir-Simpson Hurricane Wind Scale — NOAA National Hurricane Center WebView source
- 11Hurricane Safety Tips and Resources — NOAA National Weather Service WebView source
- 12About the National Hurricane Center — NOAA National Hurricane Center WebView source
- 13Tropical Cyclone Climatology — NOAA National Hurricane Center WebView source
- 14Tropical Cyclone Names — NOAA National Hurricane Center WebView source
- 15Tropical Cyclone Names — NOAA JetStream WebView source
- 16Storm Surge Overview — NOAA National Hurricane Center WebView source
- 17Tropical Cyclone Report: Hurricane Katrina, 23-30 August 2005 — NOAA National Hurricane Center 2005 WebView source
- 18Hurricane Katrina - August 2005 — NOAA National Weather Service Mobile/Pensacola 2005 WebView source
- 19Galveston Hurricane of 1900 — Texas State Historical Association 1900 WebView source
- 20NOAA Hurricane Hunters — NOAA Office of Marine and Aviation Operations WebView source
- 21Geostationary Satellites (GOES-R Series) — NOAA NESDIS WebView source
- 22Global Warming and Hurricanes — NOAA Geophysical Fluid Dynamics Laboratory WebView source