Glacier
The story of glaciers, the rivers of ice that shape mountains and continents: how snow turns to ice, glacier types and anatomy, how glaciers move and erode, the ice sheets of Greenland and Antarctica, the retreat measured from the Alps to Glacier National Park, and the Aletsch Glacier of the UNESCO-listed Jungfrau-Aletsch region.
A glacier is a body of crystalline ice, snow and rock that forms on land where snow accumulates faster than it melts, and that moves under its own weight. Glaciers cover about 10 per cent of the Earth's land surface and hold most of the planet's fresh water, from mountain valley glaciers to the Greenland and Antarctic ice sheets. They move by internal deformation and sliding, and the rock they carry carves cirques, U-shaped valleys and fjords and leaves moraines and erratics behind. Glacier mass balance is monitored worldwide: the European Alps, including the Aletsch Glacier of the UNESCO-listed Jungfrau-Aletsch region, and Glacier National Park in Montana have all lost much of their ice since the nineteenth century, while the Greenland and Antarctic ice sheets continue to lose mass to the sea.
In this article
- 1Definition and Formation
- 2Classification
- 3Global Distribution and Extent
- 4Ice Sheets
- 5Fresh Water and Sea Level
- 6Flow and Motion
- 7Landforms and Landscape
- 8Monitoring and Mass Balance
- 9Observed Loss and Recession
- 10Ice Sheet and Arctic Melt
- 11Regional Case: Glacier National Park
- 12Hazards and Consequences
- 13Timeline
- 14Timeline: from the glacial theory to the shrinking glaciers of today
- 15Knowledge graph
Definition and Formation
A glacier is any large mass of perennial ice that originates on land through the recrystallization of snow or other forms of solid precipitation and shows evidence of past or present flow. One international group has recommended that persisting snow and ice masses larger than 0.1 square kilometre (about 0.04 square mile) be counted as glaciers. Such bodies form where snow remains in the same area year round, each year's new layers burying and compressing the previous ones until the snow recrystallizes.
Glaciers begin life as snowflakes, forming where snowfall far exceeds summer melting, and the accumulating snow is buried and compressed into ice. After about a year the snow turns into firn, an intermediate state between snow and glacier ice that is about two-thirds as dense as water. The mass builds at higher elevations where more snow falls than melts.
Fallen snow compresses over many years into large, thickened ice masses that flow like slow rivers of ice under gravity and their own weight. Ice slowly moves downhill in response to gravity, and these tremendously heavy rivers of ice grind away at the underlying sediment, pushing and dragging it like a gigantic bulldozer.
1. Classification
Glaciers fall into three broad groups. Ice sheets and ice caps extend as continuous sheets and move outward in all directions. Mountain glaciers remain confined within a path that directs the movement of their ice. Piedmont glaciers and ice shelves spread out on level ground or on the ocean.
The distinction between these forms is reflected in how the ice travels. An ice sheet flows outward in all directions from its center, whereas a glacier generally flows in a single direction. Flow also varies with position and setting: near the summit of an ice sheet speeds are generally a few centimeters to a few meters per year, but near the coast they can reach hundreds of meters or even several kilometers per year.
2. Global Distribution and Extent
Glaciers exist on every continent except Australia, with roughly 91 percent of the glacier-covered area in Antarctica, 8 percent in Greenland and only small shares elsewhere. Petermann Glacier on the northwestern coast of Greenland covers 1,295 square kilometers and, at 70 kilometers long, is the longest floating glacier in the Northern Hemisphere.
Presently about 10 percent of the land area on Earth is covered with glacial ice, an area of over 15 million square kilometers (5.8 million square miles). One reference work puts the glacier-covered share at about 11 percent of the land area and the fresh water stored in glacier ice at about three-fourths of the world total. At times during the Pleistocene Epoch, which ran from 2.6 million to 11,700 years ago, glacial ice covered 30 percent of the world's land area, and the world may still be in an ice age.
Glaciers both globally and across Europe have seen a substantial and prolonged loss of mass since the middle of the 19th century. Most glaciers in the world are shrinking due to climate warming, and knowing how they evolve is crucial for projecting long-term water availability, planning hydroelectric infrastructure and assessing natural hazards. Research using the GRACE satellites found that between 2002 and 2025 Antarctica's ice loss raised global sea level by about 0.4 millimeters per year while Greenland's raised it by about 0.8 millimeters per year.
Based on the most recent comprehensive survey in 2011 there were about 27,000 glaciers in Alaska, though scientists view the number of glaciers as a misleading statistic. For the combined Alaska glaciers the 2018/19 balance year was the most negative on record and marked the seventh consecutive year of strongly negative anomalies in the region.
3. Ice Sheets
The Antarctic Ice Sheet covers almost 14 million square kilometres and contains about 30 million cubic kilometres of ice, reaching a thickness of nearly 4.9 kilometres at its thickest point; were it to melt entirely, it would raise sea level by about 58 meters.
The Greenland Ice Sheet covers about 80 percent of the world's largest island, spanning 1.7 million square kilometers and over 3 kilometers thick with about 2.9 million cubic kilometers of ice that would raise sea level by about 7.4 meters (24 feet) if it melted. Together the Antarctic and Greenland Ice Sheets contain more than 70 percent of the freshwater ice on Earth, and the Greenland Ice Sheet spans an area about three times the size of Texas.
The Greenland and East Antarctic Ice Sheets are roughly 3,000 to 4,000 meters high at their summits, while the highest areas of the West Antarctic Ice Sheet and the Antarctic Peninsula reach about 2,500 meters above sea level.
4. Fresh Water and Sea Level
Glaciers and ice caps store about 68.7 percent of the world's fresh water, and if all land ice melted, sea level would rise by approximately 70 meters (230 feet). Over the past decade, glaciers contributed to sea level rise at about 1 millimetre per year, and the ice lost in the record year 2023 was equivalent to 3.1 millimetres of rise.
Worldwide, glaciers are shrinking and receding, and glacier recession together with thermal expansion of the ocean accounts for about 75 percent of today's observed sea level rise.
Beyond the two great ice sheets, the glaciers scattered through the world's mountain ranges would raise sea level by just under half a meter (1.6 feet) if all of them melted.
5. Flow and Motion
Glaciers always flow downslope through the processes of deformation and sliding, and their flow, velocity and motion are controlled by factors including ice geometry and properties, valley geometry, bedrock and subglacial conditions, terminal environment and mass balance.
Where a glacier flows only by internal deformation, creep rates decrease with depth, so ice moves fastest at the surface and slowest or not at all at the base and valley sides. Large stresses make ice crack in a brittle manner, forming crevasses.
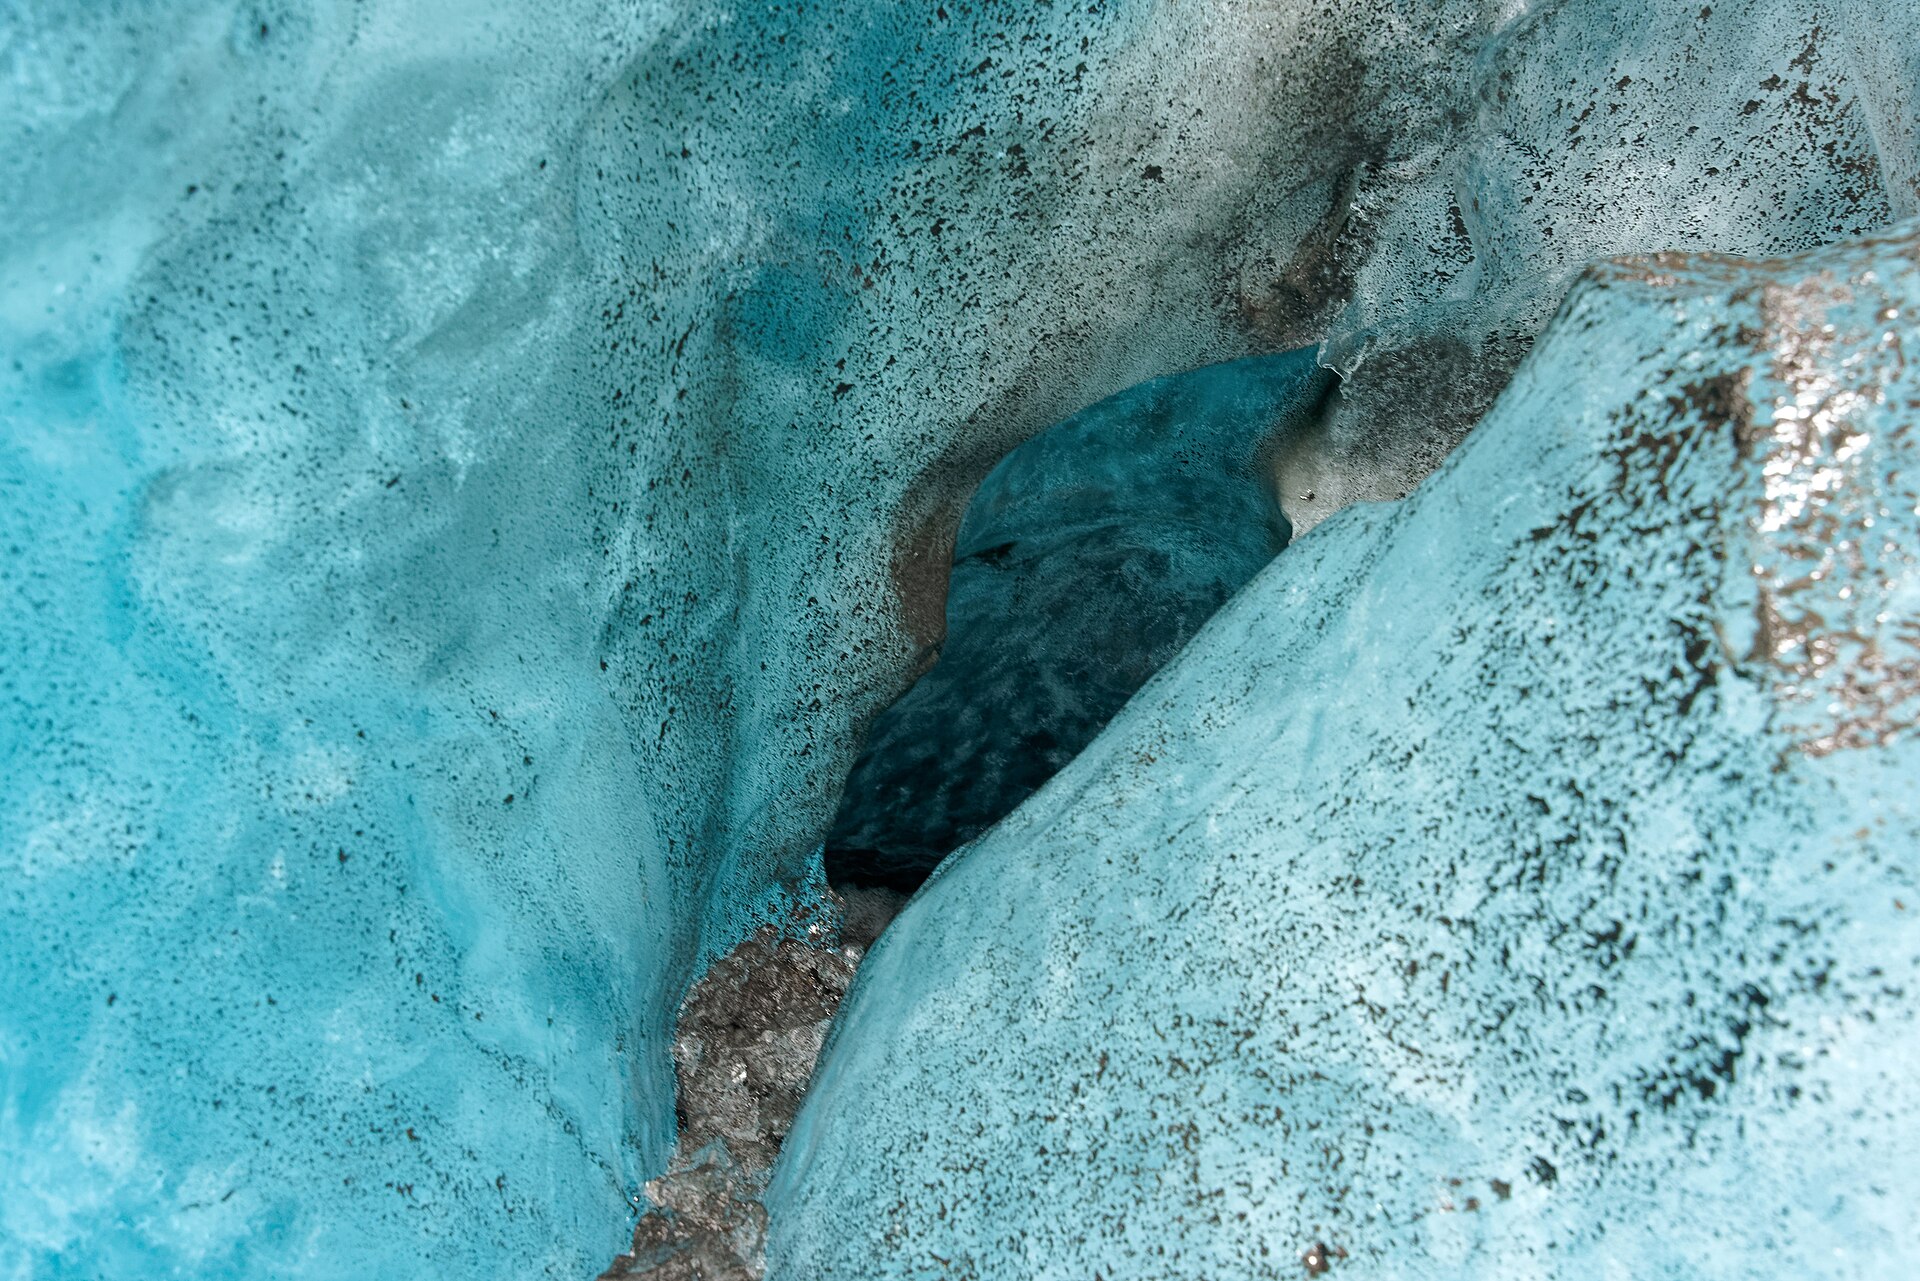
The balance velocity of a glacier is controlled by glacier mass balance and glacier geometry, but some glaciers have dynamic flow driven by other factors, such as surging glaciers, tidewater glaciers, ice streams or ice-shelf tributary glaciers.
Glaciers can also slide because ice melts under pressure, producing a film of water at the ice-bed interface; where the bed is rough with bumps and obstacles, melting and ice flow increase through a process known as regelation.
The Kutiah Glacier in Pakistan raced more than 12 kilometres in three months in 1953, averaging about 112 metres per day, the fastest recorded glacial surge.
6. Landforms and Landscape
Glaciers have a huge impact on the landscape and are among the most powerful forces shaping the Earth's surface. Glacial landforms are grouped into erosional and depositional types: erosional features include U-shaped glacial valleys, cirques and horn peaks, as seen in the abundance of such geomorphological features at the Aletsch property, while depositional features include moraines.
Different types of glaciers produce different suites of characteristic landforms, and such a suite is known as a glacial landsystem, which comprises a range of glacial landforms. Studying sediments and landform assemblages together allows geologists to say something about the style and manner of past glaciation.
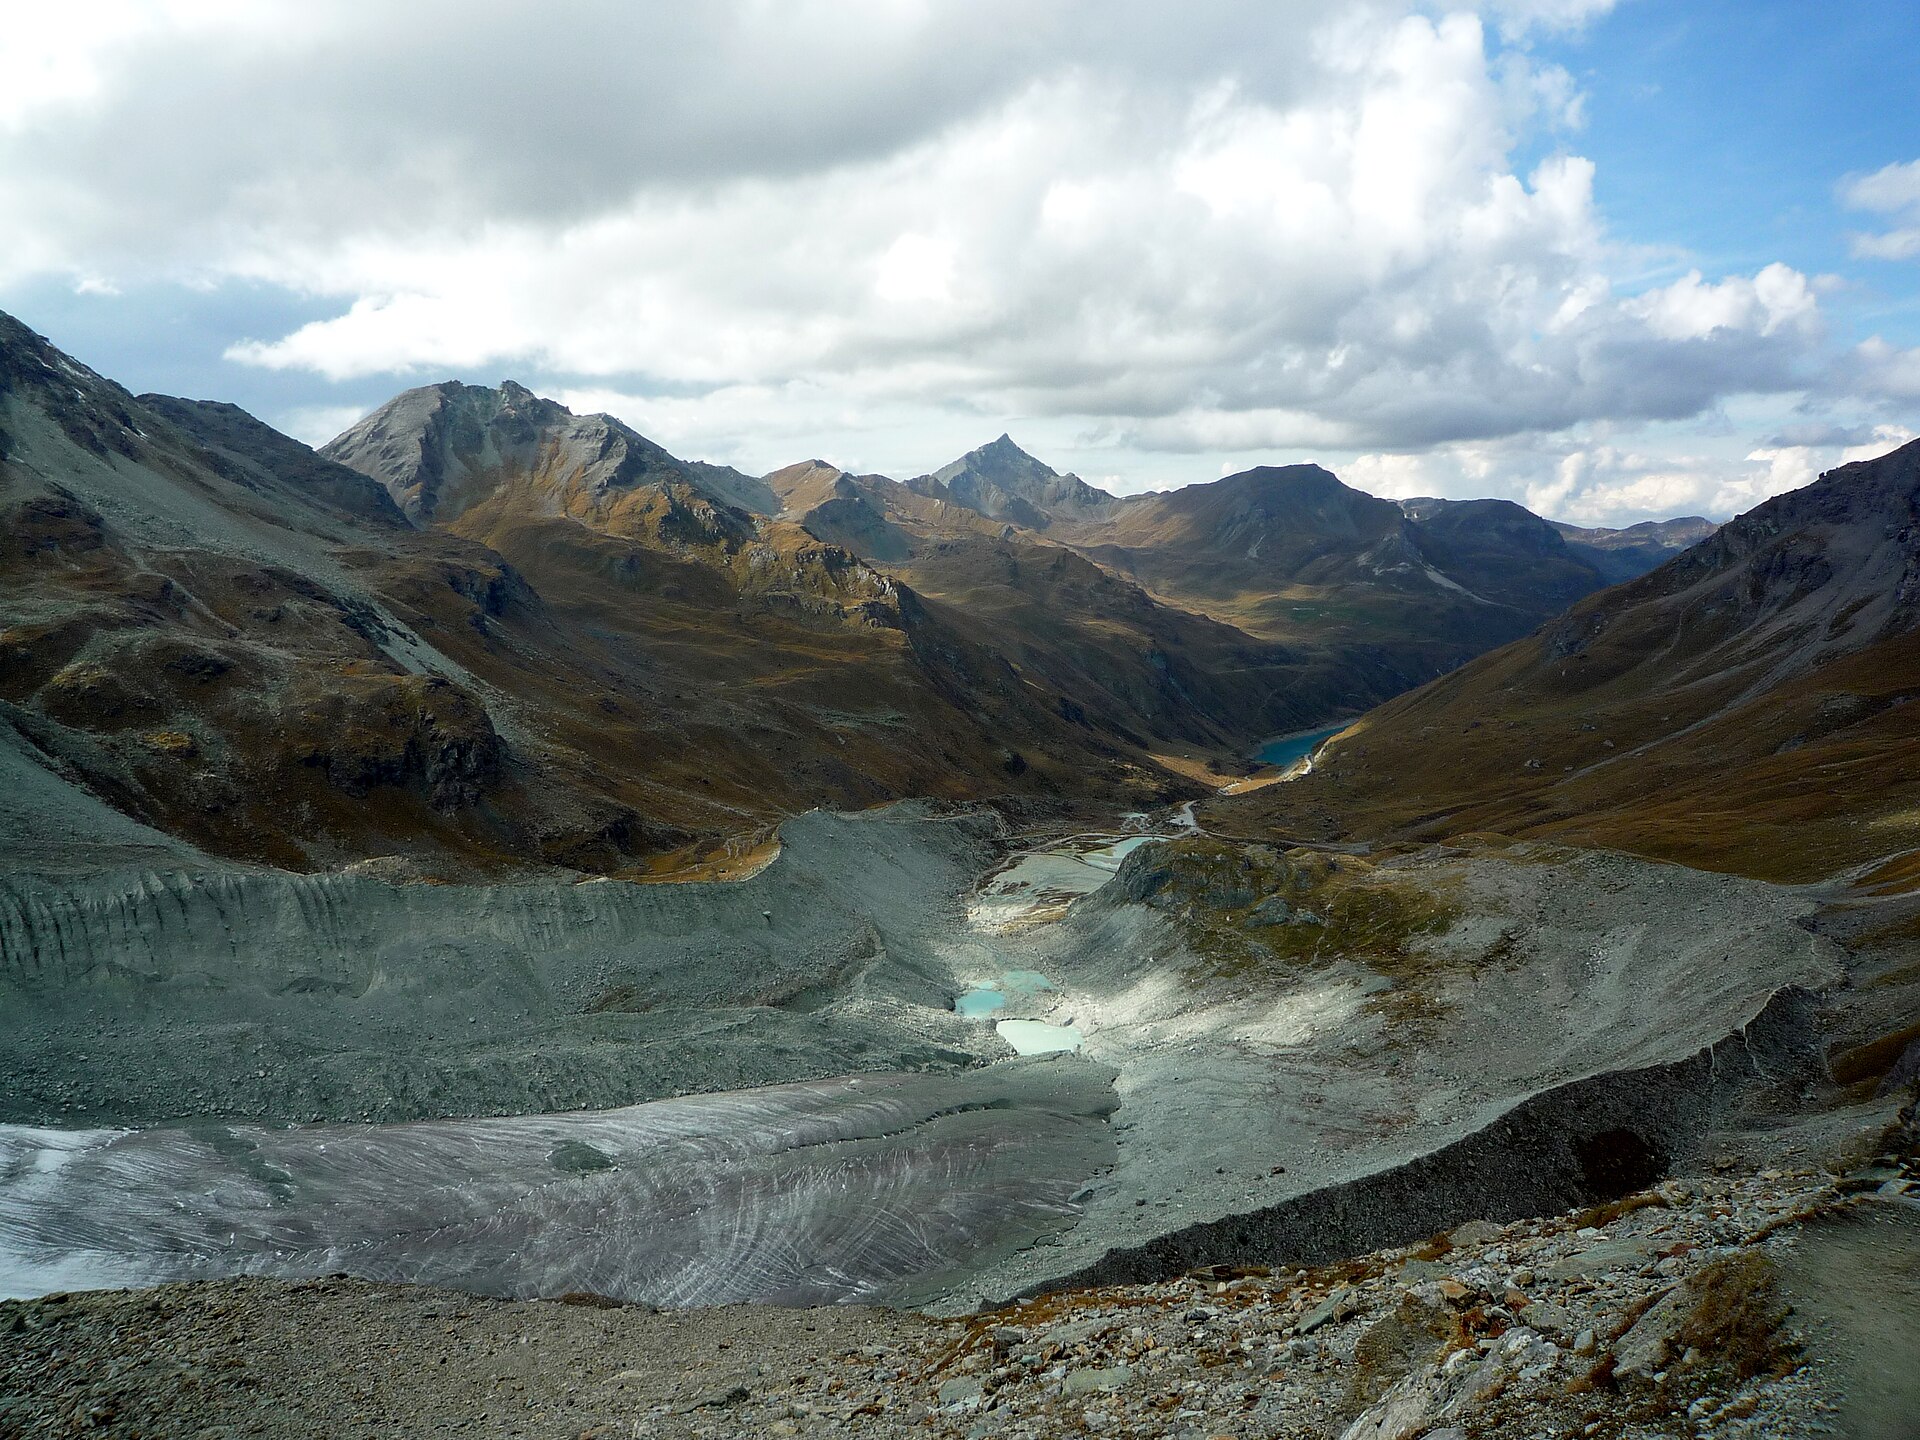
Many lakes, including the Great Lakes, and whole valleys have been carved out of the landscape by ancient glaciers.
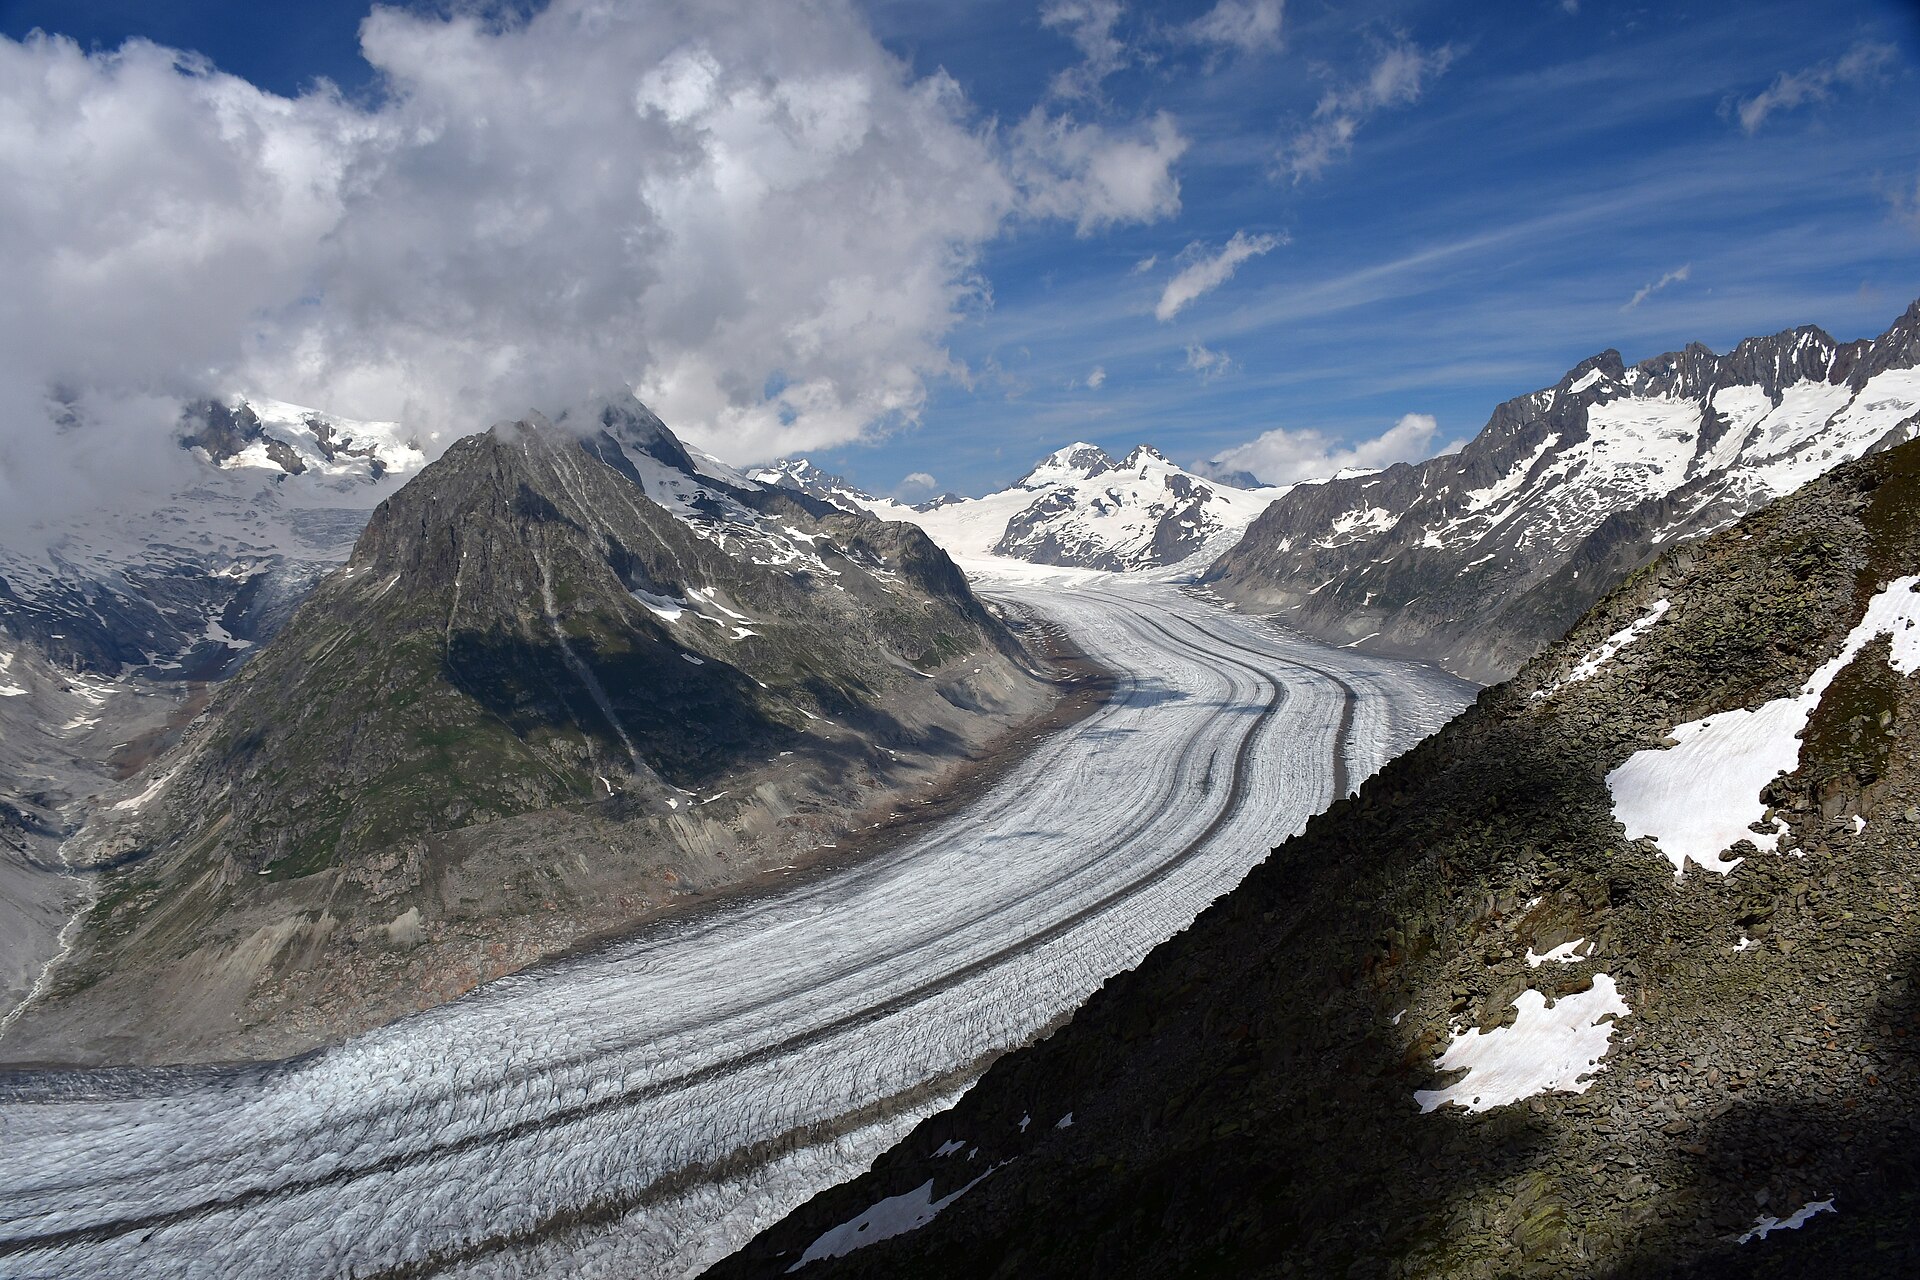
The UNESCO World Heritage property Swiss Alps Jungfrau-Aletsch includes the most glaciated part of the Alps and the largest glacier in Eurasia; the Aletsch Glacier itself, the largest and longest in Europe, lies within that glaciated area and is of scientific interest for glacial history.
7. Monitoring and Mass Balance
Glaciologists assess the state of a glacier by measuring its annual mass balance, the combined result of snow accumulation and melt over a given year. Cumulative long-term trends in mass balance serve as an indicator of climate change.
Global reference glaciers with more than 30 years of continued observation form the basis of the WGMS mass balance estimates. These estimates are compiled in annual calls-for-data from a scientific collaboration network in more than 40 countries.
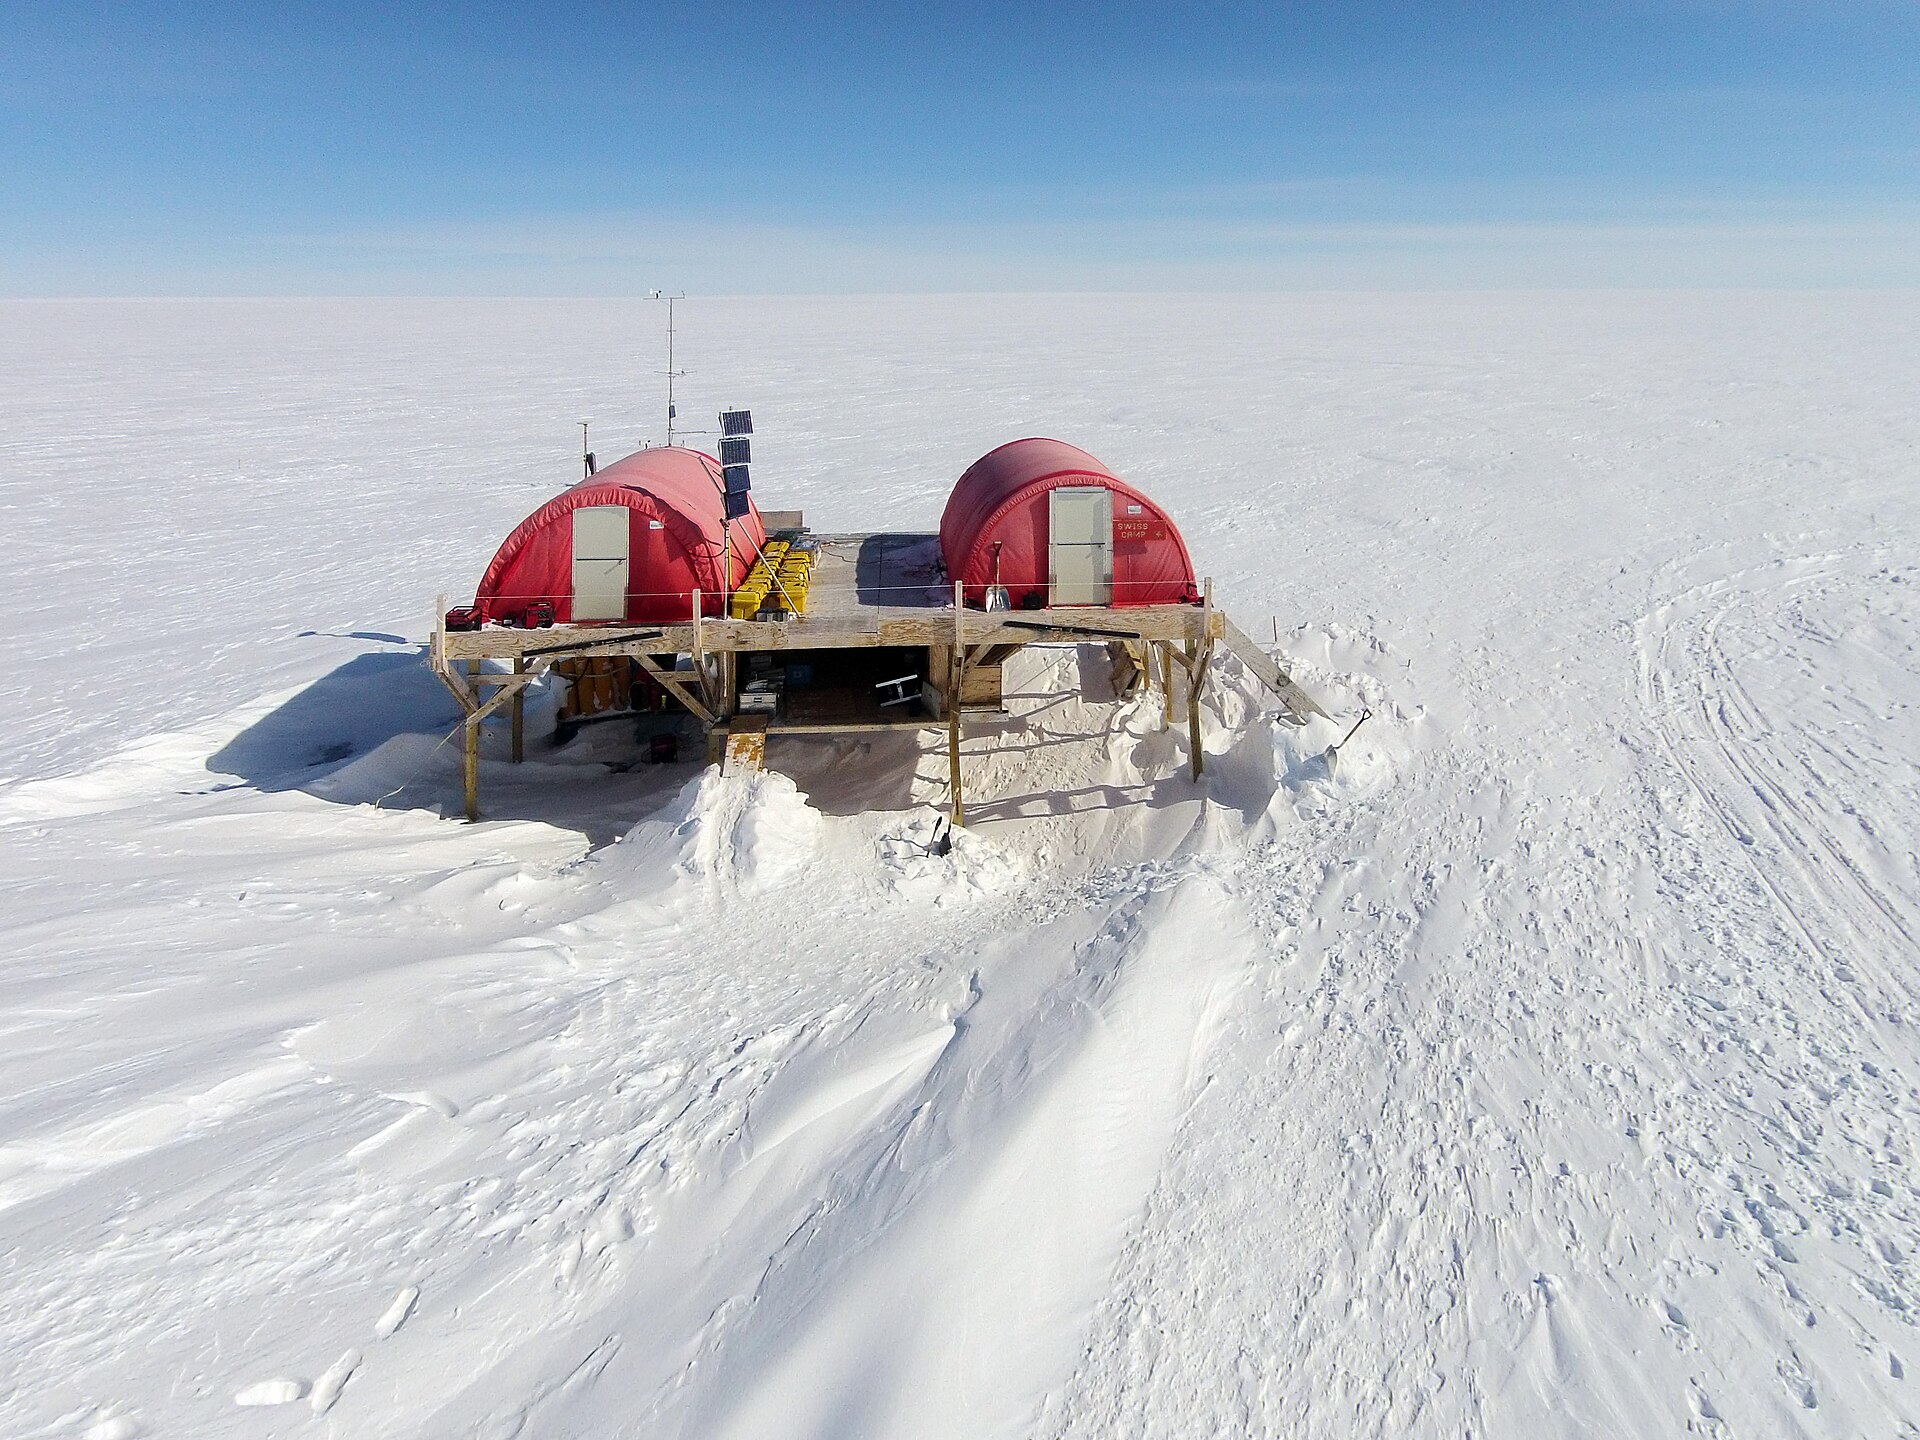
Glacier inventories list roughly 220,000 glaciers outside the ice sheets, covering about 700,000 square kilometres and holding about 158,000 cubic kilometres of ice. Global glacier mass-loss estimates combine glaciological field measurements from around 500 glaciers with geodetic satellite measurements covering around 200,000 of them.
8. Observed Loss and Recession
The most negative annual mass balance in the latest WGMS summary was -5.638 m w.e., reported for the 2023/24 balance year. The WMO State of the Global Climate 2023 report showed that records were once again broken, and in some cases smashed, for greenhouse gas levels, surface temperatures, ocean heat and acidification, sea level rise, Antarctic sea ice cover and glacier retreat. The same report confirmed 2023 as the warmest year on record, with the global average near-surface temperature 1.45 degrees Celsius above the pre-industrial baseline.
Since 2010 eight of the ten most negative mass-balance years for the observed reference glaciers have been recorded, and the last three years each brought an annual ice loss of more than 1 m w.e..
Across the full record, the cumulative ice loss from glaciers since 1975 amounts to 9,580 gigatonnes of water, of which 7,500 gigatonnes has been lost since the year 2000 alone.
Taken as a whole, the cumulative mass loss of the global reference glaciers exceeds 30 m w.e.
9. Ice Sheet and Arctic Melt
Antarctica loses ice mass at an average rate of about 135 billion tons per year while Greenland loses about 266 billion tons per year, and the meltwater drains into the ocean and contributes to sea level rise.
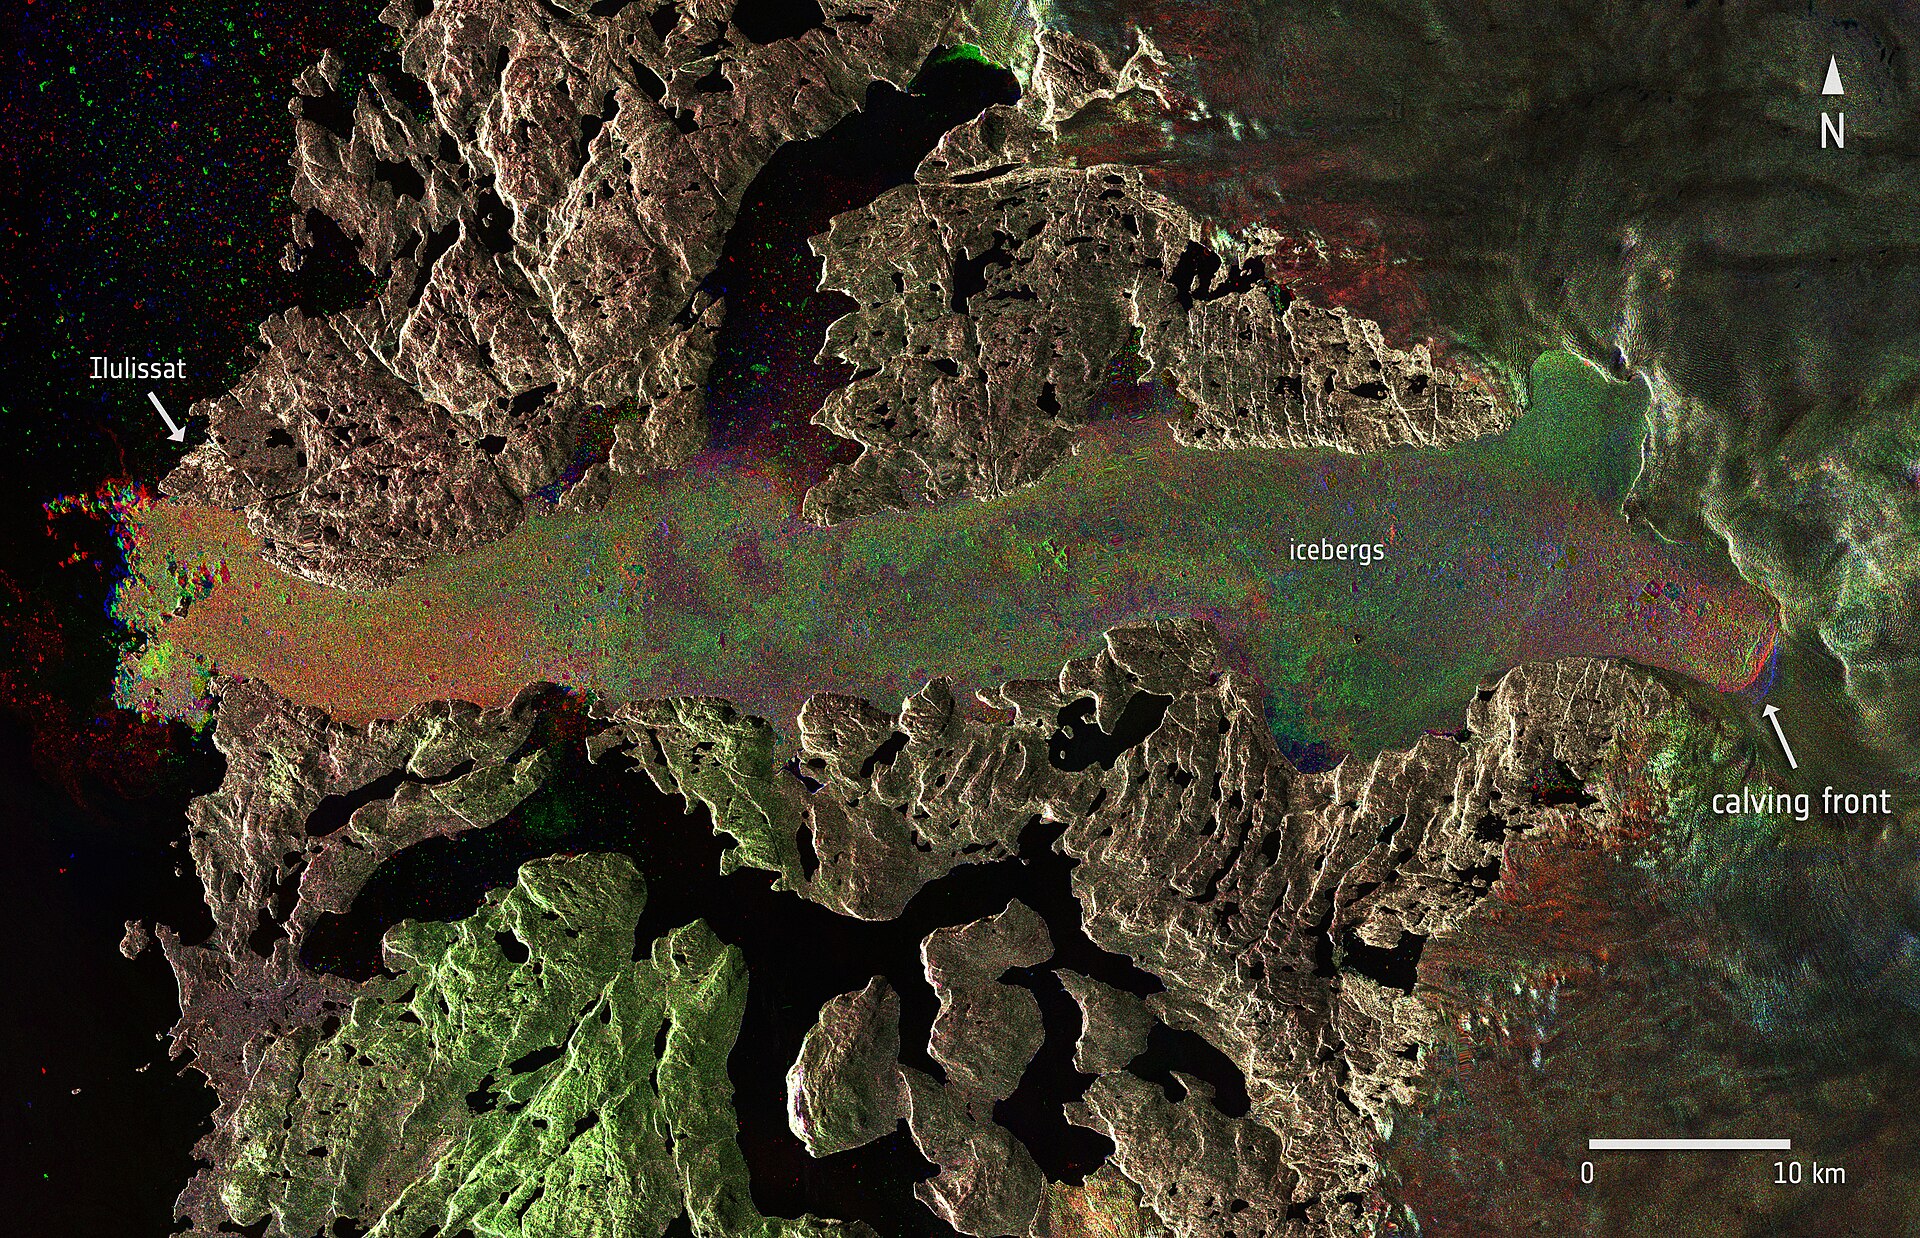
Satellite radar interferometry shows the ice sheets' average flow lines converging on prominent outlet glaciers and coinciding with the areas of highest mass loss, evidence that warming ocean waters play a key role in contemporary ice mass loss.
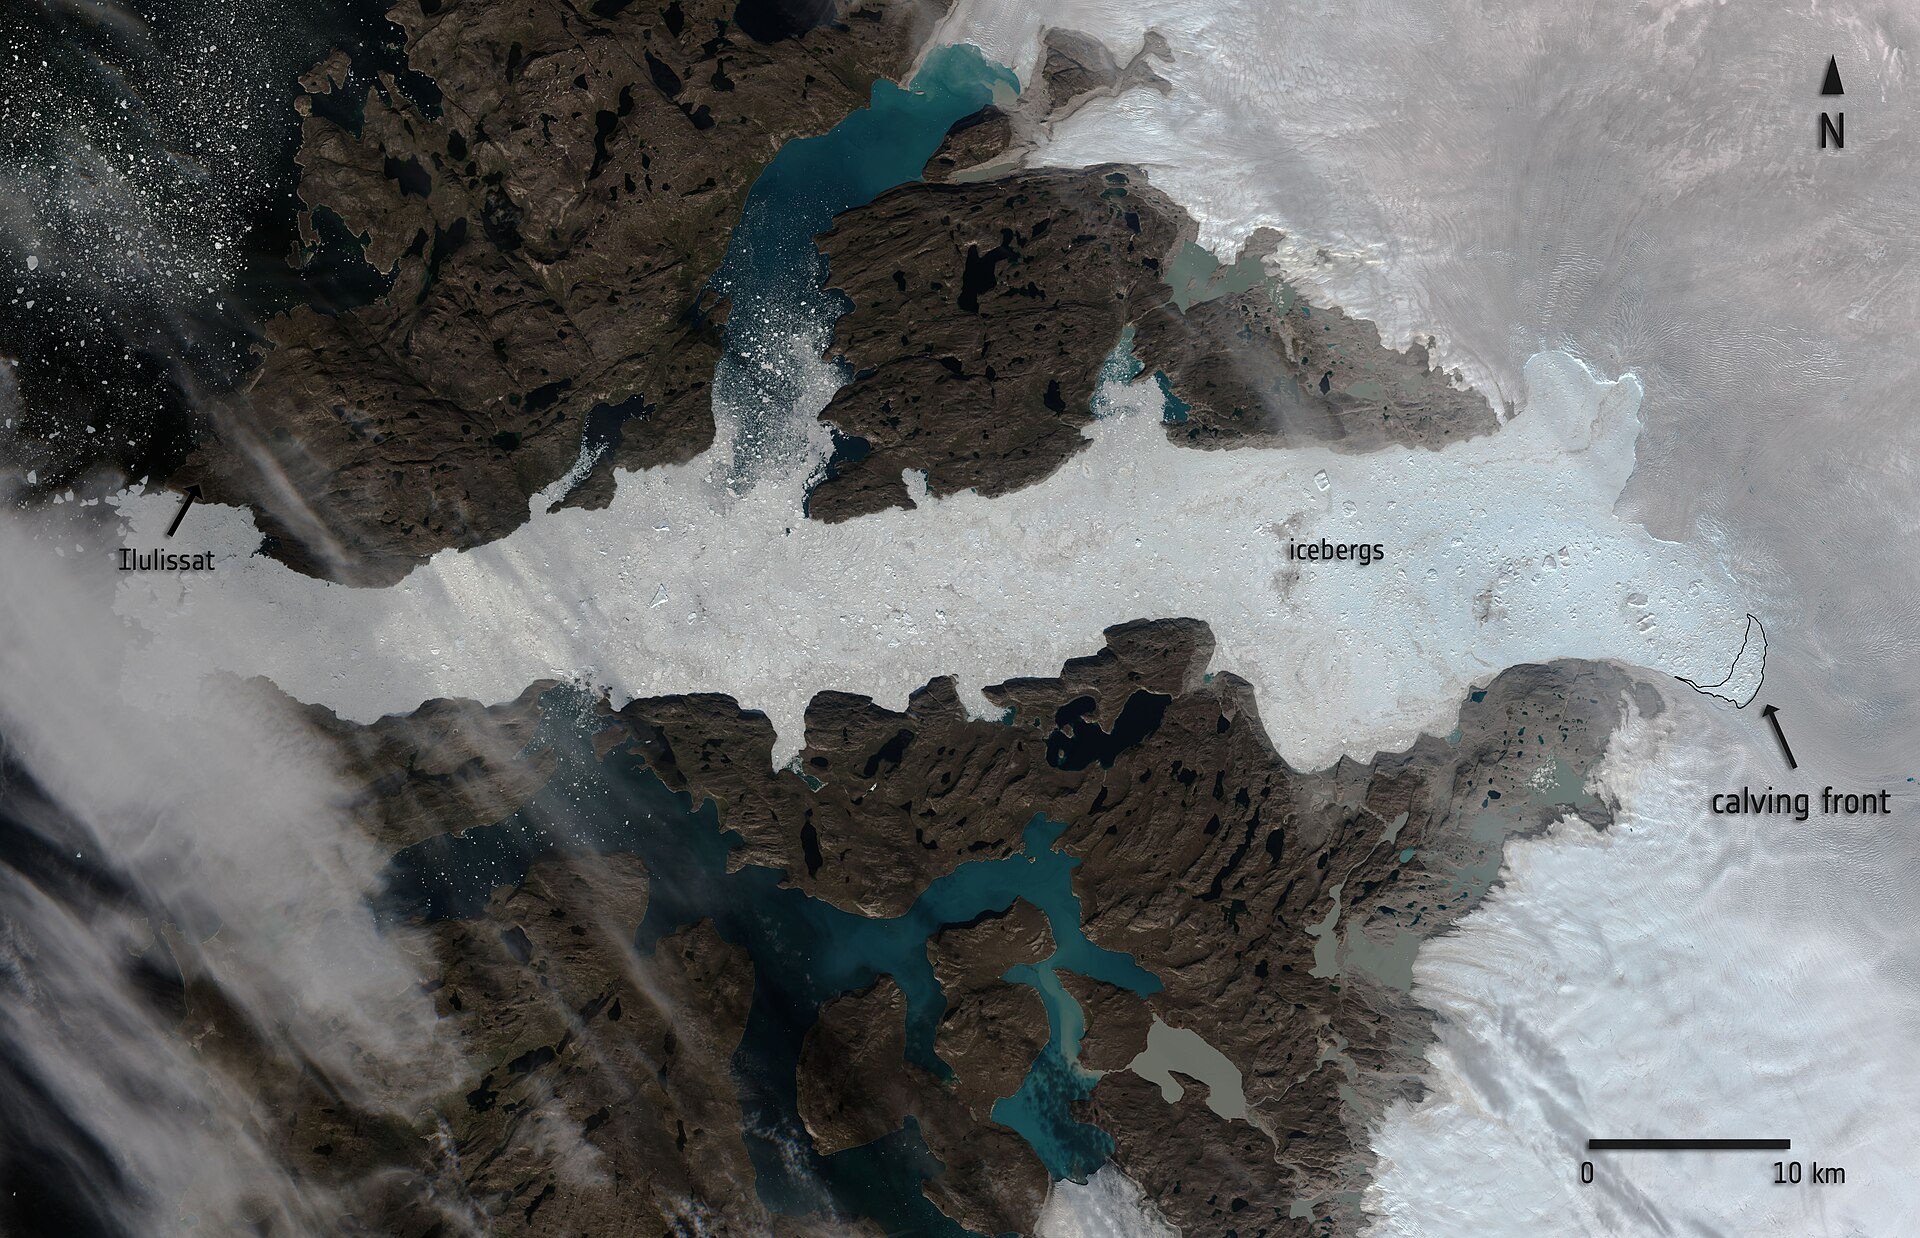
Between 2002 and 2019 Arctic glaciers and ice caps outside Greenland lost an estimated 164 gigatons of ice per year, a contribution of approximately 0.4 millimeters per year to global sea level rise.
10. Regional Case: Glacier National Park
When President Taft created Glacier National Park in 1910 it held an estimated 150 glaciers, and fewer than 30 remain today, most of them shrunk in area by two-thirds.
Aerial imagery from 2015 showed 26 named glaciers in Glacier National Park that met the size criteria of 0.1 square kilometres, nine fewer than in 1966 and some may now be too small to be considered glaciers.
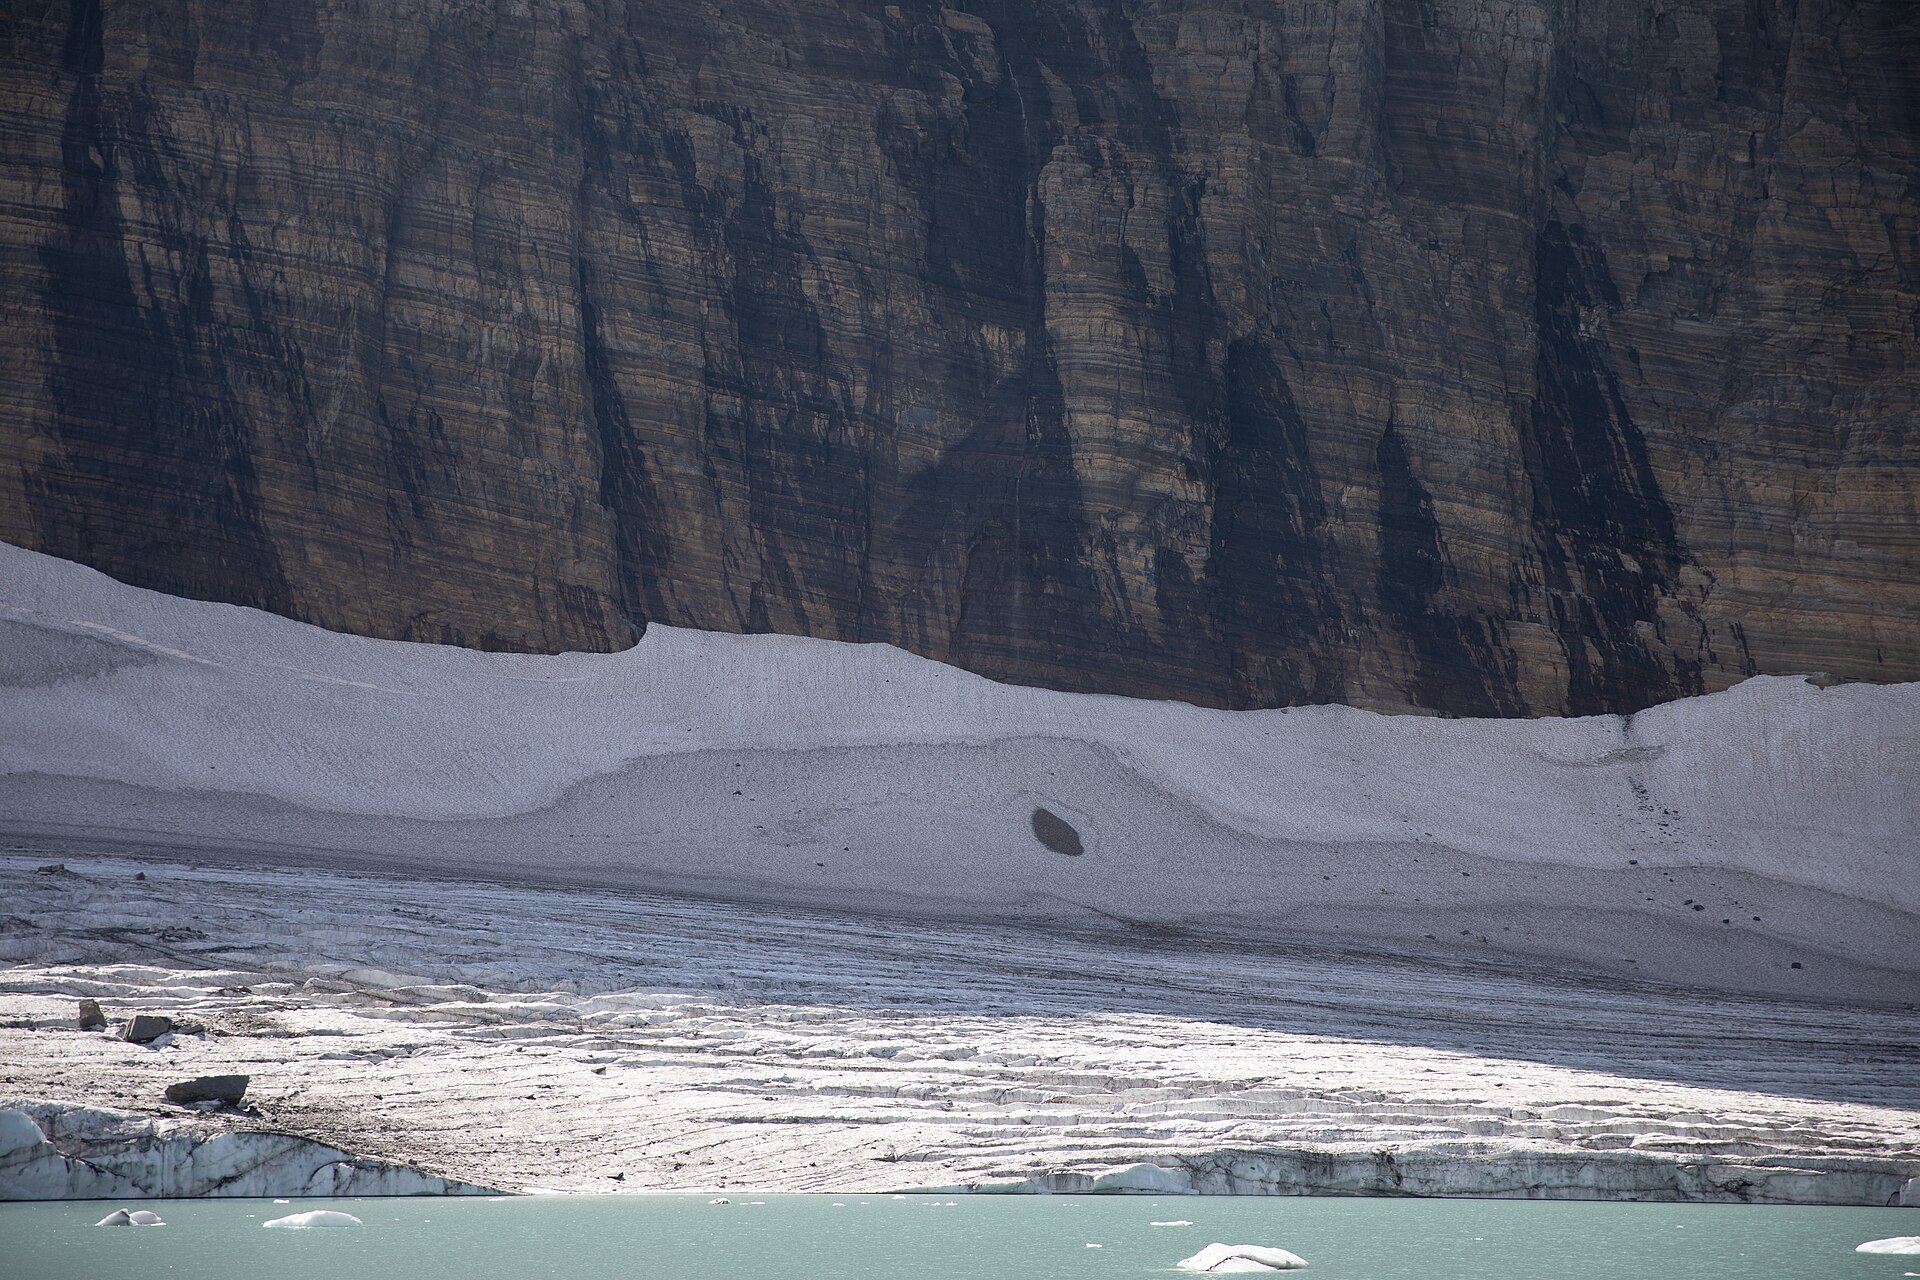
The loss of glaciers since the end of the Little Ice Age reflects both natural and human-caused climate change, but the retreat of recent decades can be increasingly attributed to human causes.
11. Hazards and Consequences
A glacial lake outburst flood, or GLOF, is the release of meltwater from a lake dammed by a moraine or by ice when that dam fails, and such floods often cause catastrophic flooding downstream with major geomorphic and socioeconomic impacts.
Numerical simulations combined with direct observations and climate projections are used to anticipate how all glaciers on Earth will evolve, and the results help assess impacts ranging from contributions to global sea level to water availability in glacierized basins and future landscapes.
The West Antarctic ice sheet alone contains enough ice to raise sea level by nearly 20 feet (6 meters) if it were to break up, though scientists consider that very unlikely this century.
An ice-dammed lake drains when the ice dam floats: once the lake reaches about 90 percent of the dam height, the ice lifts from the bed and water escapes through subglacial conduits, which close up again as the lake empties and its level falls.
Some of the largest floods in Earth's history have been glacial lake outburst floods, which in Peru alone were responsible for roughly 32,000 deaths in the twentieth century. Moraine dams are narrow and sharp-crested and are usually built of loose, poorly sorted sediment, some of it containing ice cores, which makes them more likely to fail than broader dam types.
12. Timeline
-
2.6 million to 11,700 years agoPleistocene glaciationDuring the Pleistocene Epoch glacial ice covered 30 percent of the world's land area at times, and the world may still be in an ice age 1Glacier · Encyclopaedia Britannica ↗.
-
since 2010Most negative mass-balance yearsEight of the ten most negative mass-balance years for the observed reference glaciers have been recorded since 2010 15Global Glacier State · World Glacier Monitoring Service (WGMS) ↗.
-
last three yearsAnnual loss above 1 m w.e.Each of the last three years brought an annual ice loss of more than 1 m w.e. 15.
13. Timeline: from the glacial theory to the shrinking glaciers of today
- around 1850Glacier National Park's glaciers reach their greatest extentAt the end of the Little Ice Age the glaciers of what would become Glacier National Park are at their largest, with about 80 glaciers in the area, before a warming trend sets in.
- 1894Internationally coordinated glacier monitoring beginsSystematic international observation of glacier changes starts, the beginning of the series that the World Glacier Monitoring Service continues today.
- 1910Glacier National Park is created in MontanaPresident Taft creates Glacier National Park, which is then home to an estimated 150 glaciers.
- 1949/50The reference-glacier mass-balance series beginsThe WGMS series of global reference glaciers with more than 30 years of continuous observation starts with the balance year 1949/50 and runs into the twenty-first century.
- since 1950Warming accelerates in the Glacier National Park regionAnnual temperatures in the Glacier National Park region have risen by about 2-3 degrees Fahrenheit since 1950 and the growing season is now about 12 days longer.
- 1953The Kutiah Glacier's record surgeThe Kutiah Glacier in Pakistan races more than 12 kilometres in three months, averaging about 112 metres per day, the fastest glacial surge on record.
- 1975Global glacier records beginThe global record of glacier mass change starts, providing the baseline for the cumulative loss measured since then.
- since 2000Glacier melt accelerates after 2000Since the year 2000 about 79 per cent of the glacier contribution to sea-level rise recorded since 1975 has melted, marking an acceleration in mass loss.
- 2001Jungfrau-Aletsch-Bietschhorn joins the World Heritage ListThe Swiss Alps Jungfrau-Aletsch property, the most glaciated part of the Alps, is first inscribed on the UNESCO World Heritage List.
- 2002Satellites begin continuous monitoring of the ice sheetsThe NASA-German GRACE mission starts collecting the data that reveal the Greenland and Antarctic ice sheets losing mass.
- 2011A comprehensive count of Alaska's glaciersThe most recent comprehensive survey counts about 27,000 glaciers in Alaska, though scientists note that the number of glaciers is a misleading statistic.
- 2015Aerial imagery counts Glacier National Park's remaining glaciersImagery from 2015 identifies 26 named glaciers in the park that meet the size criteria — nine fewer than in 1966 — and some may already be too small to count.
- 2018/19A record loss year for Arctic glaciersIce loss across Arctic glaciers and ice caps outside Greenland is dominated by melting in Alaska, Arctic Canada and Svalbard, and 2019 produces the most negative mass balance year on record for the region.
- 2023The warmest year on record brings record glacier retreatThe World Meteorological Organization confirms that 2023 was the warmest year on record, with the global average near-surface temperature about 1.45 degrees Celsius above the pre-industrial baseline, and reports records broken for glacier retreat.
- 2023/24The most negative mass balance year for the reference glaciersThe latest WGMS summary reports the most negative annual mass balance of the reference glacier series, -5.638 m w.e., for the 2023/24 balance year.
References (22)
- 1Glacier — Encyclopaedia Britannica Web↩View source
- 2Glaciers — National Snow and Ice Data Center (NSIDC) WebView source
- 3Glaciers and Icecaps — U.S. Geological Survey (USGS) Water Science School WebView source
- 4Ice Sheets — National Snow and Ice Data Center (NSIDC) WebView source
- 5What is a glacier? (USGS FAQ) — U.S. Geological Survey (USGS) WebView source
- 6Glacier Quick Facts — National Snow and Ice Data Center (NSIDC) WebView source
- 7Glaciers (Climate Indicators) — Copernicus Climate Change Service (C3S), ECMWF WebView source
- 8Glaciology - Laboratory of Hydraulics, Hydrology and Glaciology — ETH Zurich (VAW) WebView source
- 9Ice Sheets — NASA Science WebView source
- 10Glaciers and Ice Caps Outside Greenland - Arctic Report Card — NOAA Arctic Program 2020 WebView source
- 11Glacier Recession — AntarcticGlaciers.org (Royal Holloway, University of London) WebView source
- 12Glacier Flow — AntarcticGlaciers.org (Royal Holloway, University of London) WebView source
- 13Glacial Landforms — AntarcticGlaciers.org (Royal Holloway, University of London) WebView source
- 14Swiss Alps Jungfrau-Aletsch — UNESCO World Heritage Centre WebView source
- 15Global Glacier State — World Glacier Monitoring Service (WGMS) Web↩View source
- 16Latest Glacier Mass Balance Data — World Glacier Monitoring Service (WGMS) WebView source
- 17State of the Global Climate 2023 — World Meteorological Organization (WMO) 2023 WebView source
- 18Big Thaw — National Geographic WebView source
- 19Glacier's Glaciers — U.S. National Park Service, Glacier National Park WebView source
- 20Climate Change - Glacier National Park — U.S. National Park Service WebView source
- 21Glacial Lake Outburst Floods — AntarcticGlaciers.org (Royal Holloway, University of London) WebView source
- 22World Glacier Monitoring Service — World Glacier Monitoring Service (WGMS), University of Zurich WebView source
 Apollo 11
 International Space Station
 Saturn