Aurora
How the solar wind and Earth's magnetosphere produce the aurora borealis and aurora australis, from emission lines and auroral ovals to forecasting, history and folklore.
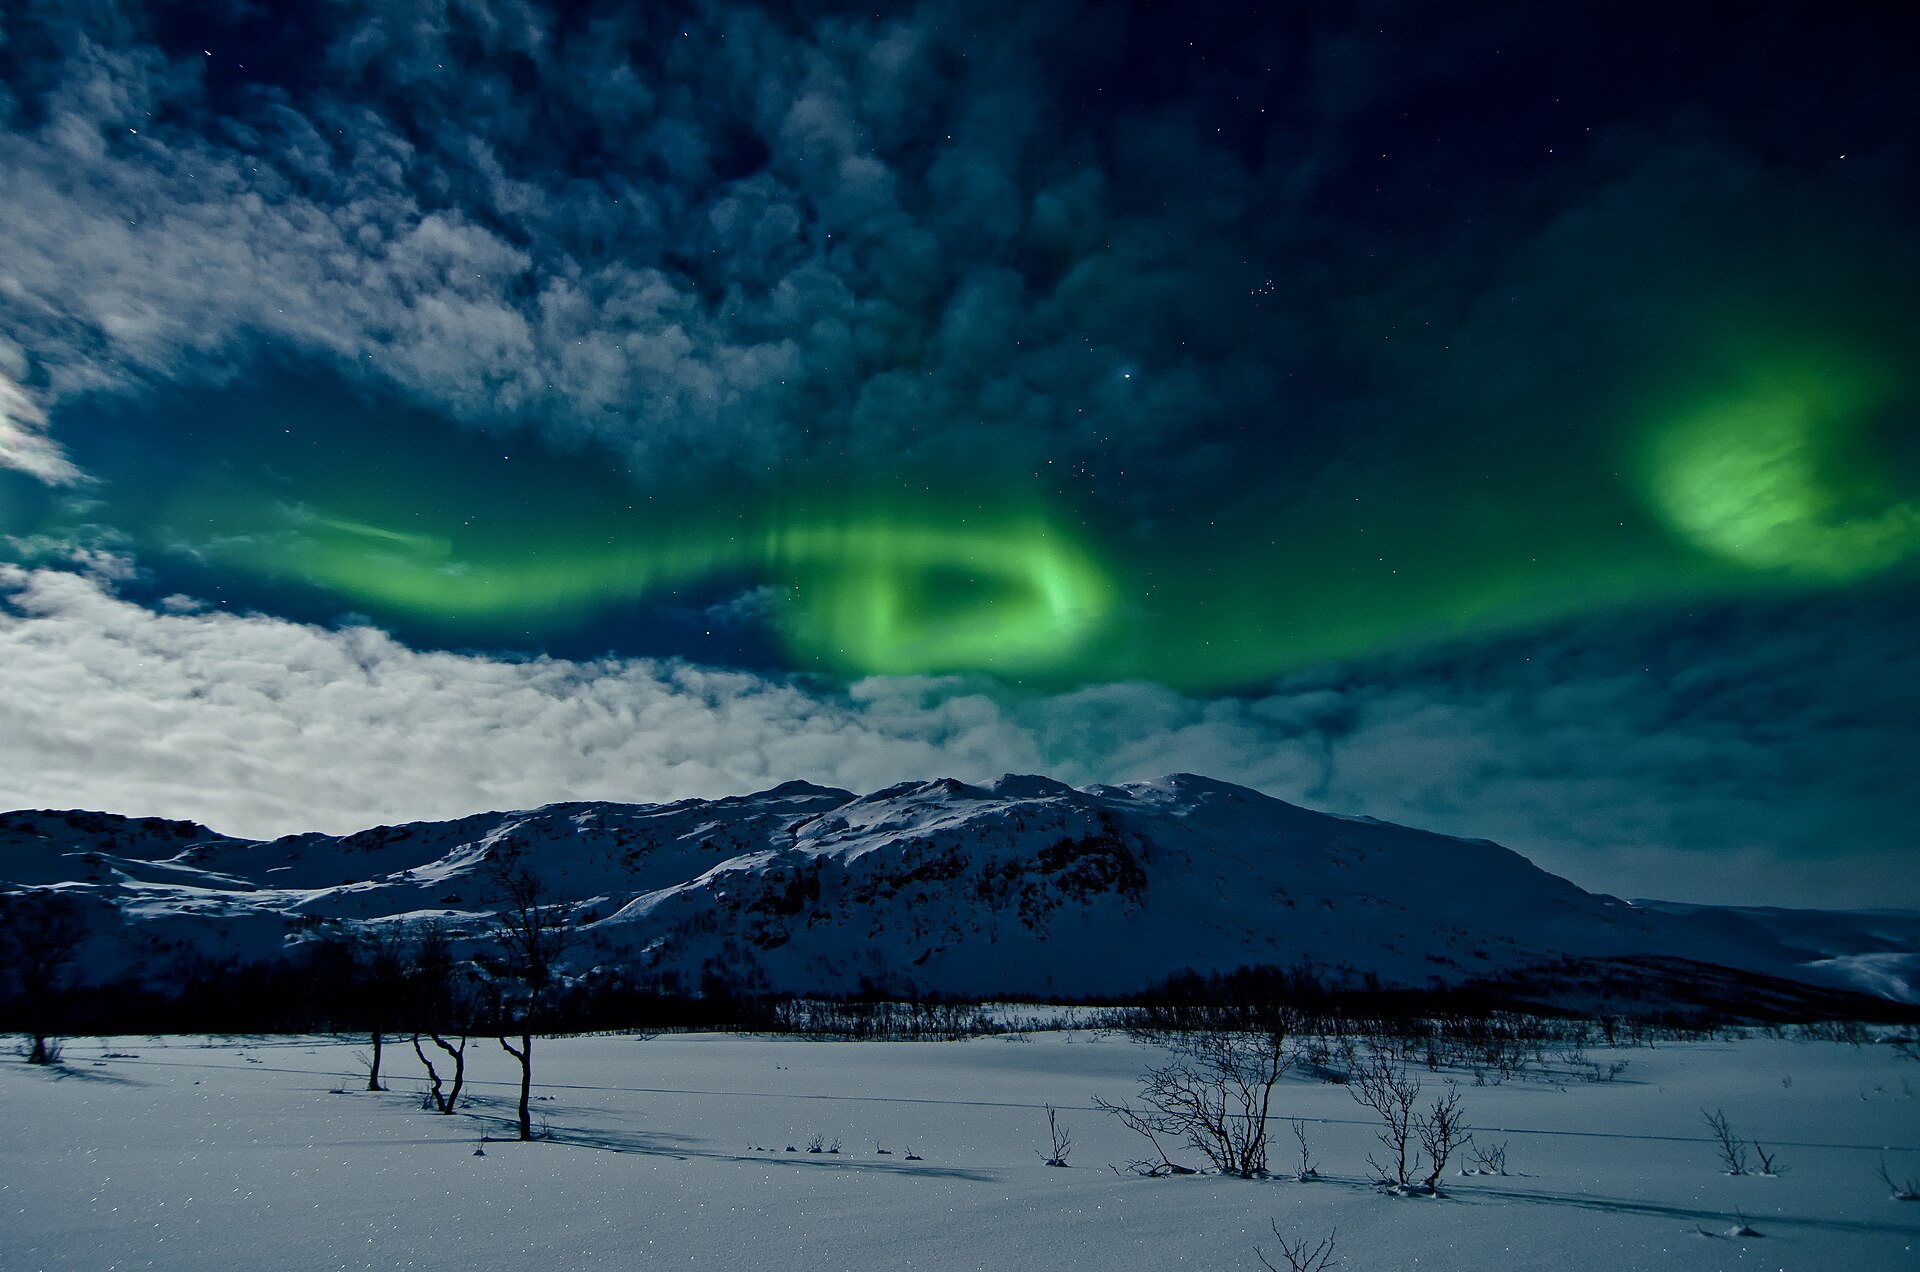
Auroras are the light displays produced when energetic particles driven by the solar wind precipitate into Earth's upper atmosphere along the planet's magnetic field. They form two oval bands around the magnetic poles and glow in the characteristic colours of atomic oxygen and molecular nitrogen at altitudes of roughly 80 to 500 km.
In this article
- 1Overview
- 2Physical Cause and Mechanism
- 3Altitude, Latitude and the Auroral Oval
- 4Colours and Emission Lines
- 5Forecasting and the Kp Index
- 6Viewing Conditions and Practical Notes
- 7Historical Observations and Research
- 8Auroras Beyond Earth
- 9Cultural Significance
- 10Key Dates
- 11Frequently Asked Questions
- 12Timeline
- 13Knowledge graph
Overview
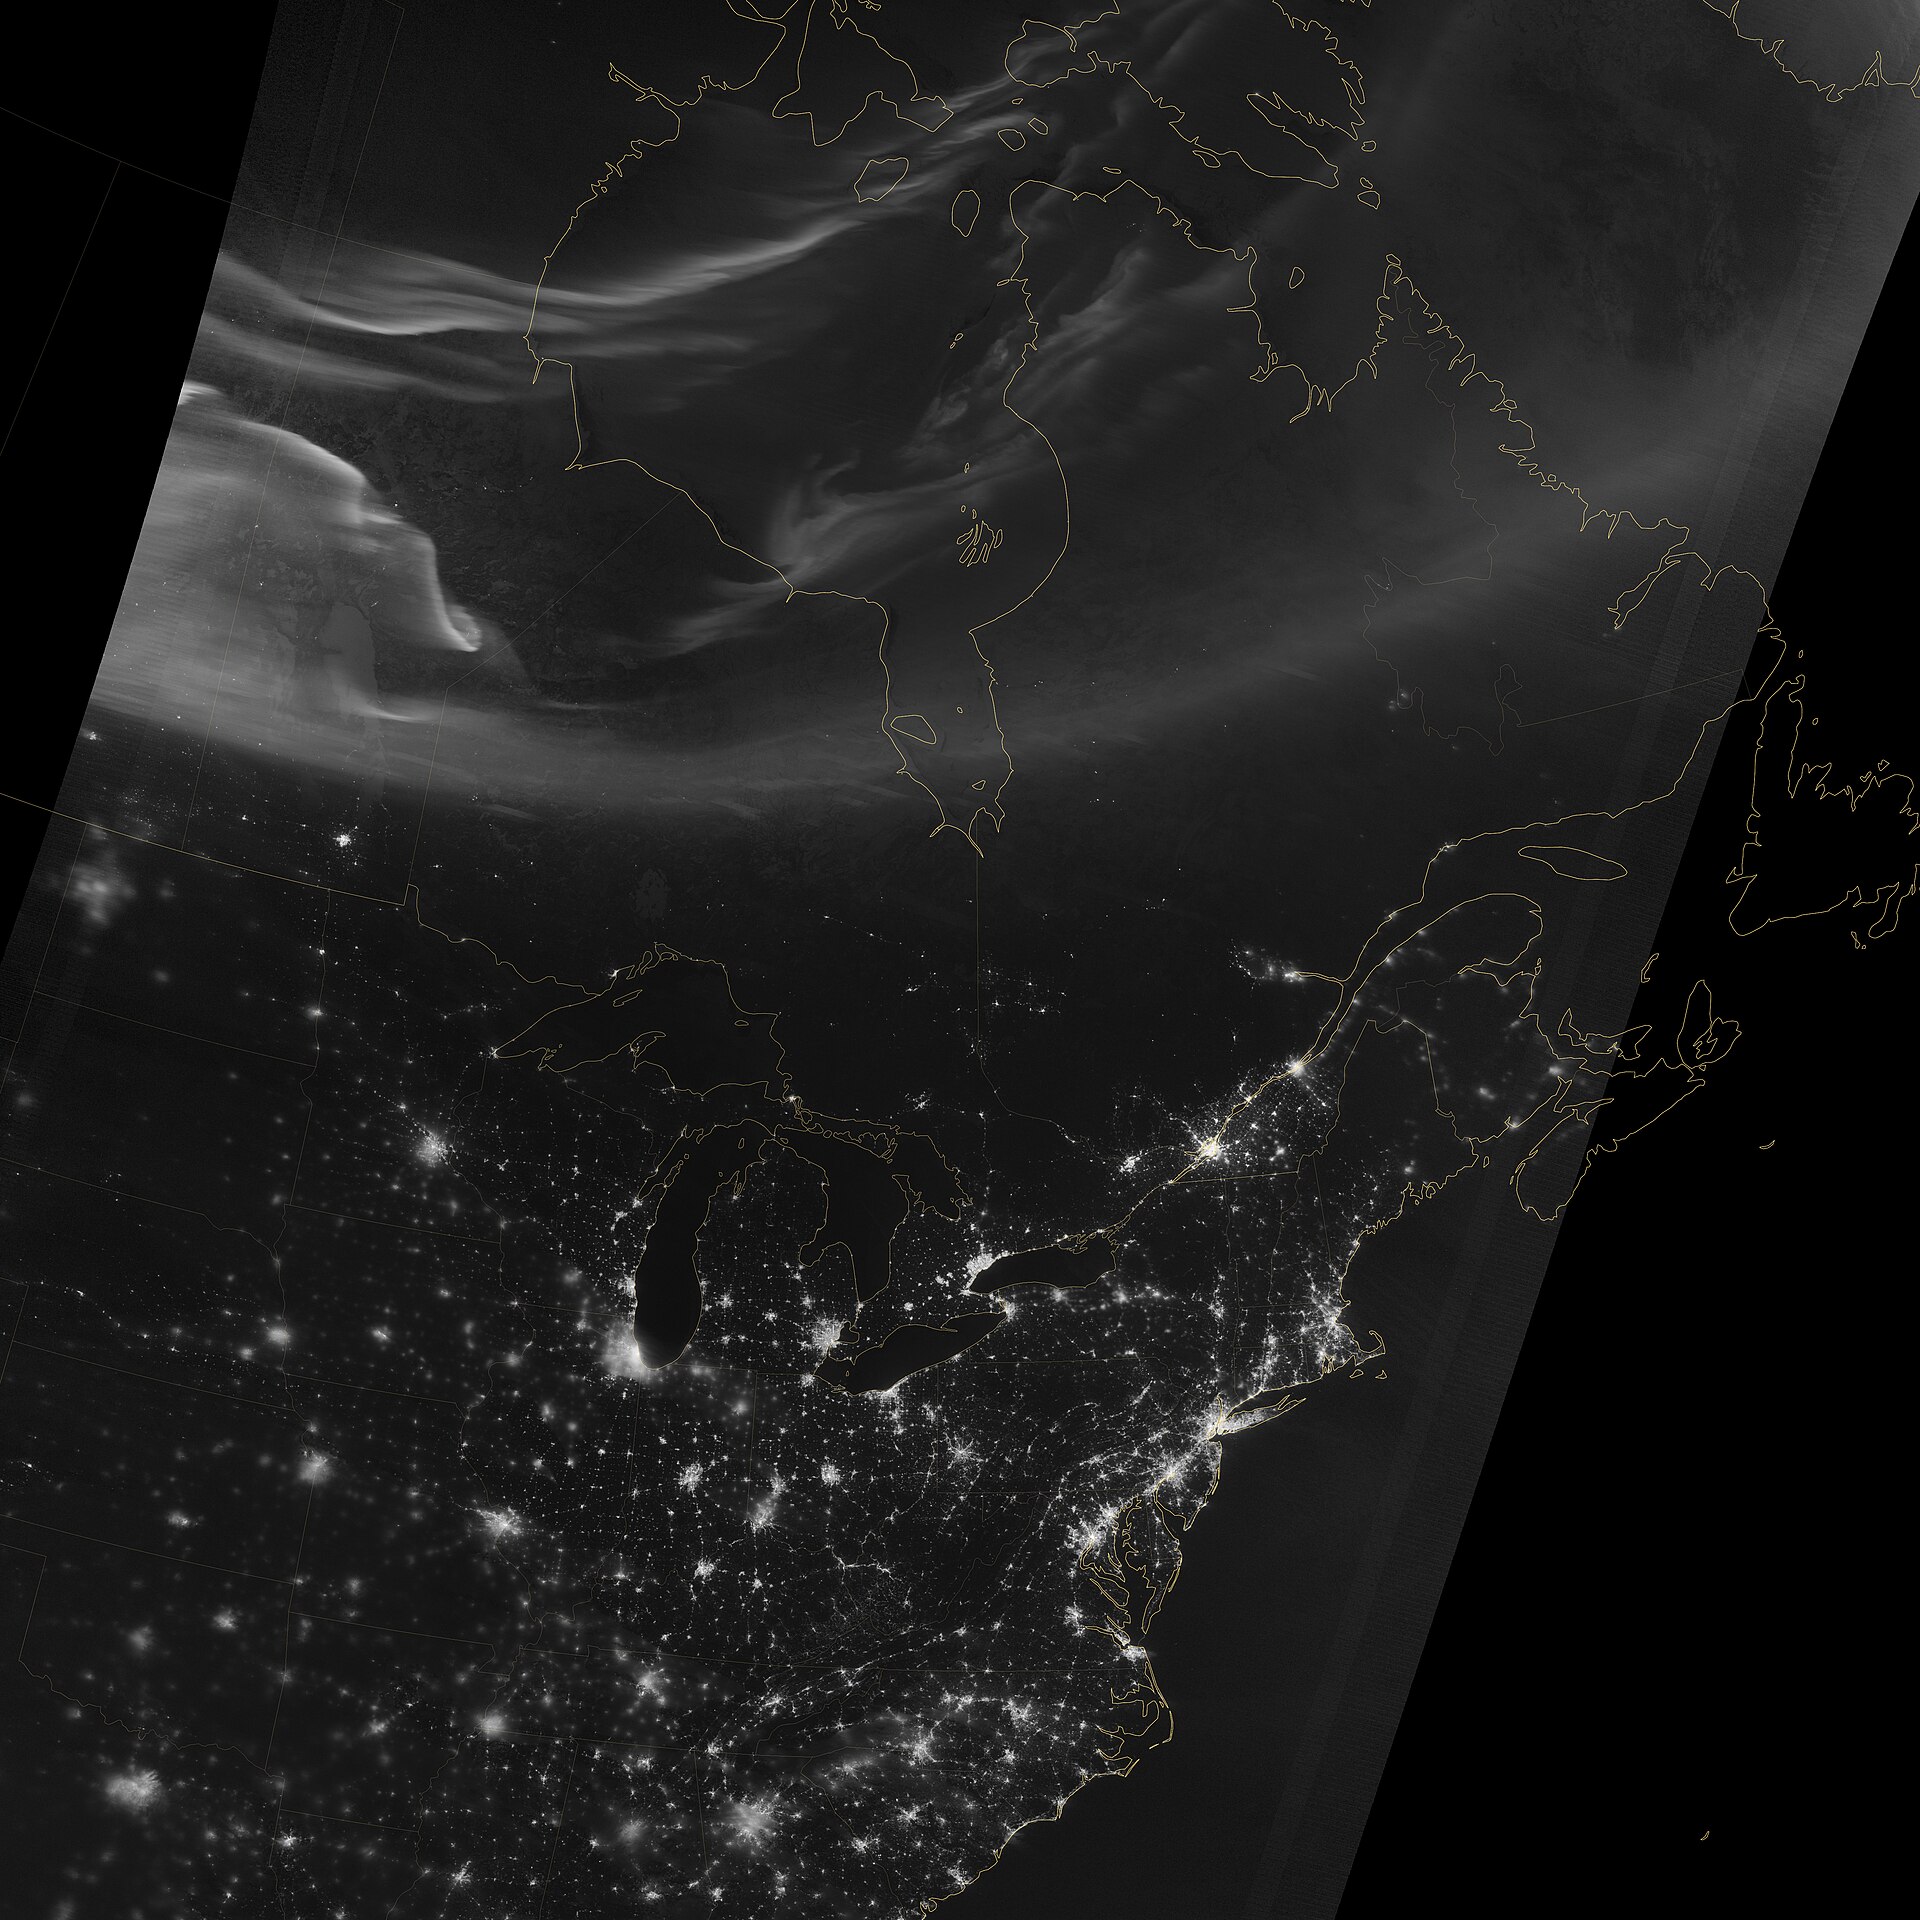
The aurora is light produced when electrons collide with the upper reaches of Earth's atmosphere, appearing in the Northern Hemisphere as the aurora borealis and in the Southern Hemisphere as the aurora australis. It occurs in an oval around the magnetic poles in both hemispheres, so that the southern lights and the northern lights are the two faces of a single phenomenon. The display appears as two ovals approximately centered on the magnetic poles. At polar latitudes the aurora appears on about half the nights of a given year.
1. Physical Cause and Mechanism
Auroral light begins with the solar wind, the stream of charged particles emitted by the sun. As that wind flows outward it drags the Sun's magnetic field along with it, and the Sun's rotation stretches the field into a spiral shape. Energy from the solar wind is exchanged very efficiently into the space environment around Earth during a geomagnetic storm, a major disturbance of the magnetosphere. Such storms are created most effectively by sustained periods of high-speed solar wind together with a southward-directed solar wind magnetic field at the dayside of the magnetosphere. Less intense but longer-lasting driving comes from high-speed streams that plow into slower solar wind and form co-rotating interaction regions, which deposit more energy over a longer interval than coronal mass ejection storms.
A coronal mass ejection is a large expulsion of plasma and magnetic field from the Sun's corona that can carry billions of tons of material. These ejections travel outward at speeds ranging from below 250 km/s to nearly 3000 km/s, and the fastest ones directed at Earth can arrive in as little as 15 to 18 hours while slower ones take several days. The most explosive ejections begin when highly twisted magnetic flux ropes in the lower corona become too stressed and realign through a process called magnetic reconnection.
The particles that actually produce the glow are electrons and protons, and their precipitation injects millions of amps into the atmosphere. Collisions between these particles and oxygen and nitrogen atoms and molecules excite them to higher energy states, which release light on relaxation. The colour that results depends on which gas is struck and at what altitude the collision occurs.
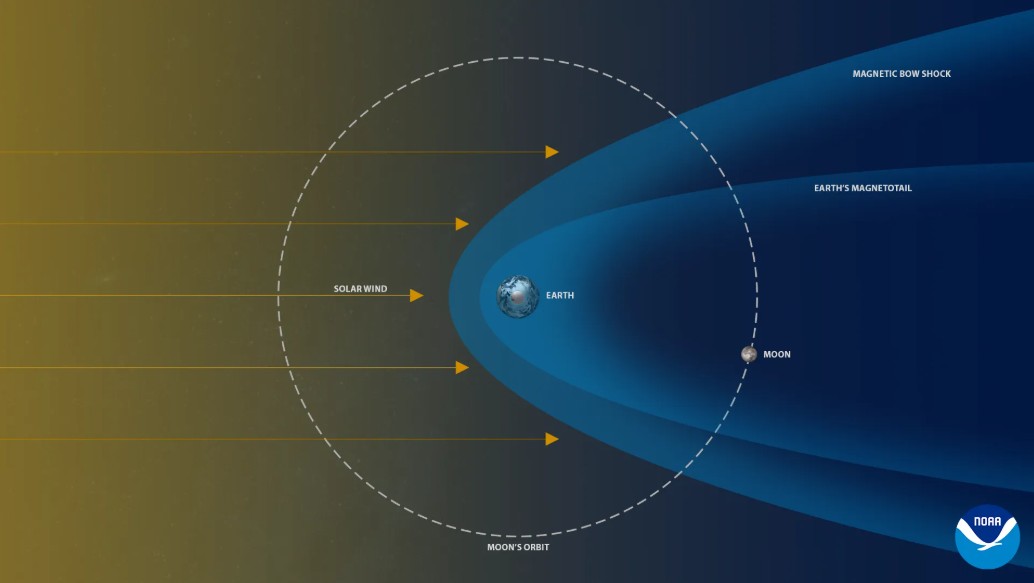
Three ingredients are required for a planet to have an aurora: solar wind, a magnetic field, and an atmosphere. Earth's magnetosphere, the region of space dominated by the planet's own magnetic field, shields the planet from solar and cosmic particle radiation and from erosion of the atmosphere by the solar wind. Constant bombardment compresses the sun-facing side of that field, though the dayside still extends about six to 10 times the planet's radius, while the nightside stretches into an immense magnetotail that can measure hundreds of Earth radii, reaching far beyond the Moon's orbit at 60 Earth radii. The gases of the atmosphere give off light when struck, much as a neon sign glows. During a storm the westward ring current around Earth is tracked by the disturbance storm time index, while field-aligned currents connect to intense auroral electrojets that also produce large magnetic disturbances.
2. Altitude, Latitude and the Auroral Oval
Aurora appears at a typical altitude range of about 80 to 500 km above Earth's surface. The best viewing latitudes lie between about 60 and 75 degrees north and south latitude. The northern lights form a band that is normally about 500 to 1,000 km wide, positioned on average over Yellowknife in the Northwest Territories and Grande rivière de la Baleine in Quebec.
The auroral oval's equatorward edge sits near 66 degrees magnetic latitude at Kp 0 and moves about 2 degrees equatorward per Kp step to roughly 48 degrees at Kp 9. During intense activity the oval may expand as far south as Miami, Florida, a reach recorded in August 1972 and beyond. The expansion toward the equator can reach over Tasmania.
3. Colours and Emission Lines
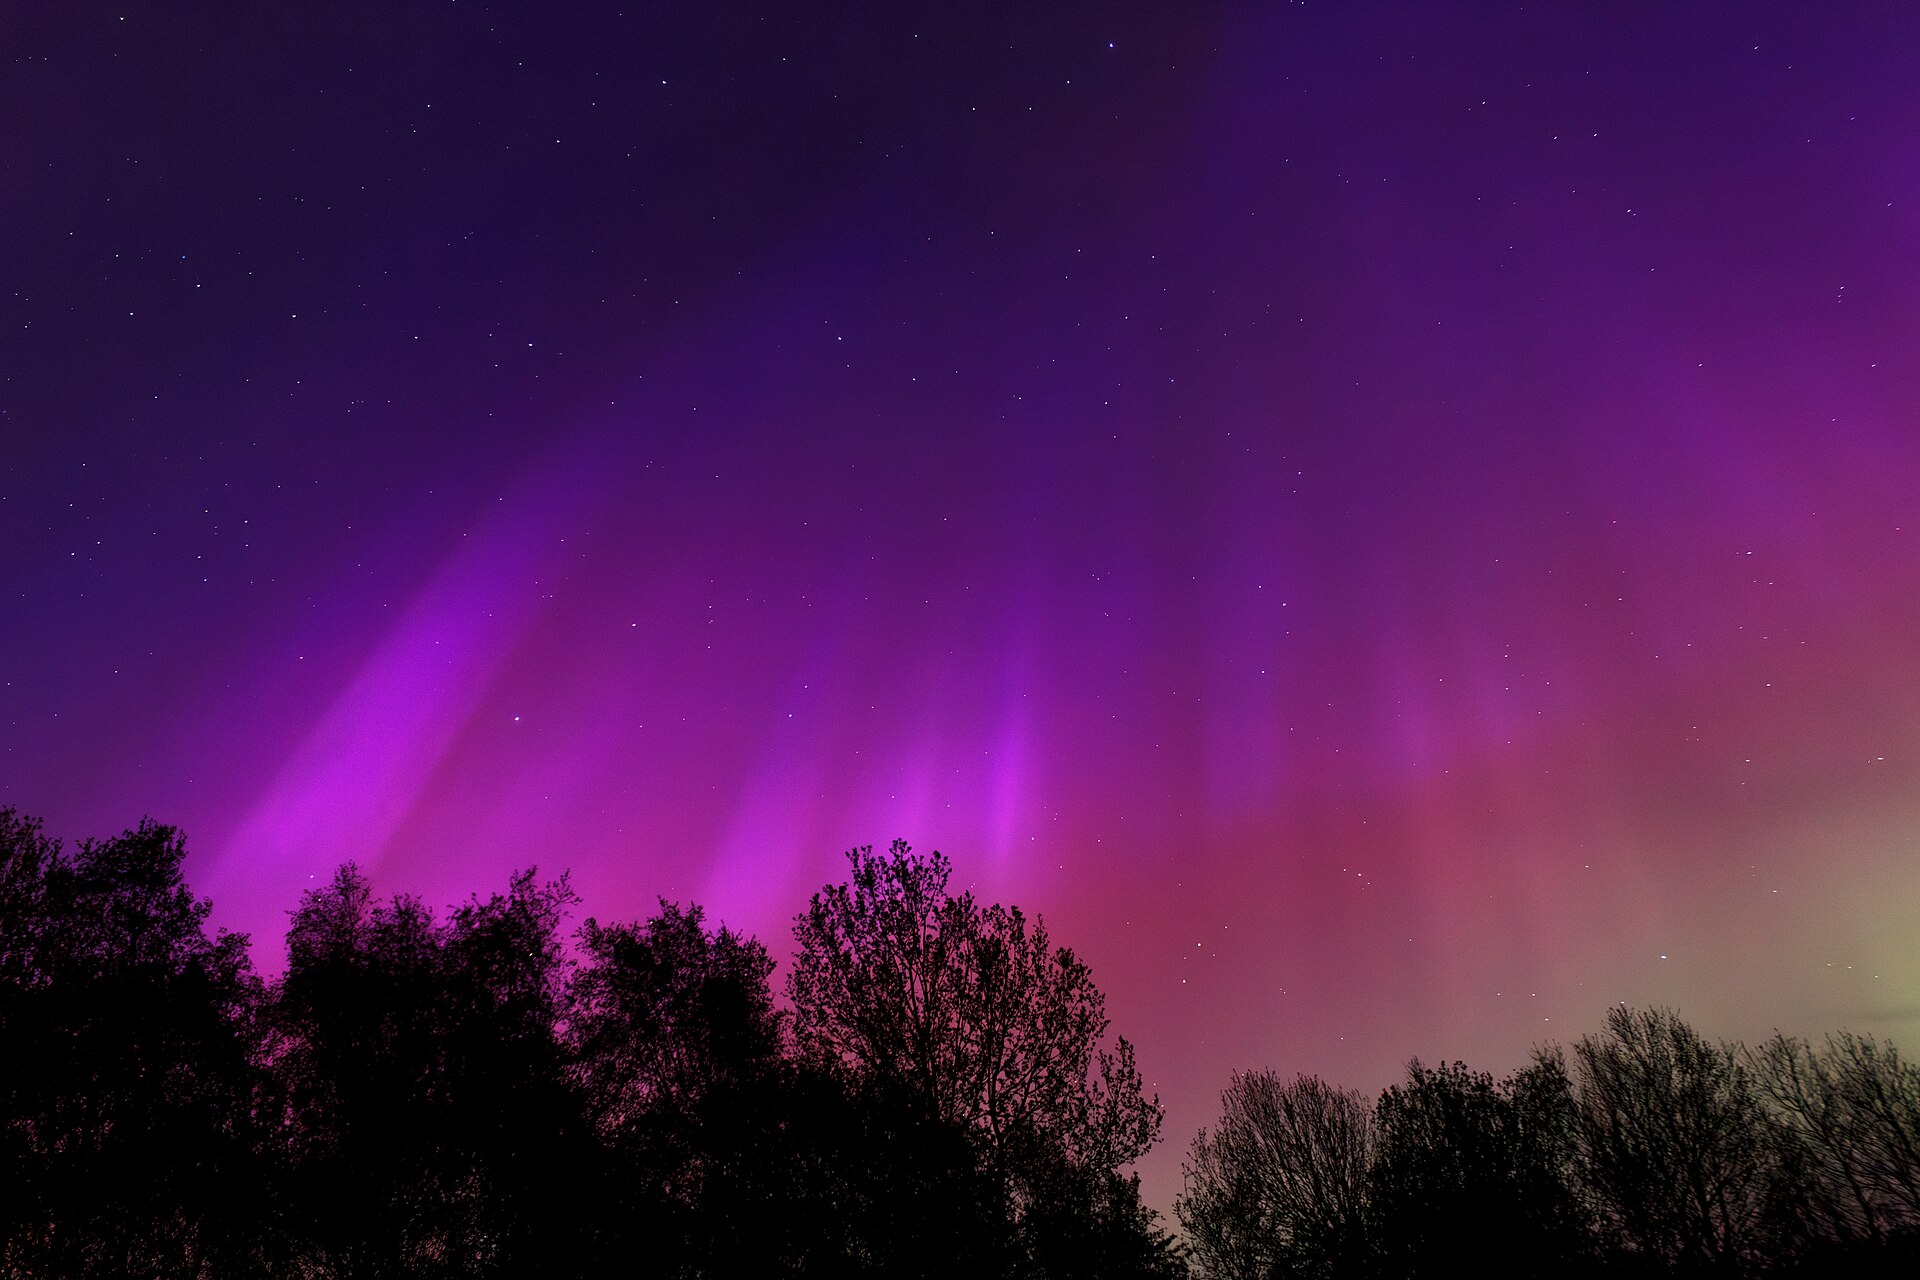
The colour of an aurora depends on which gas is struck and where the collision occurs. Green is the most common colour, produced by oxygen at roughly 100 km altitude; green appears from about 100 to 200 km while red appears above 200 km. Red is caused by oxygen high in the atmosphere, green by oxygen in the middle layers, and purple by nitrogen lower down.
The green line at 557.7 nm (5577 Å) is emitted by atomic oxygen and is generally the brightest auroral emission. The red line at 630.0 nm (6300 Å) comes from atomic oxygen in its transition from the lowest excited electronic state to the ground state, is sometimes seen at the upper border of arcs, and has peak emission typically between 200 and 400 km. The blue-violet 427.8 nm (4278 Å) emission lies in the blue region of the visible spectrum and comes from the molecular nitrogen ion.
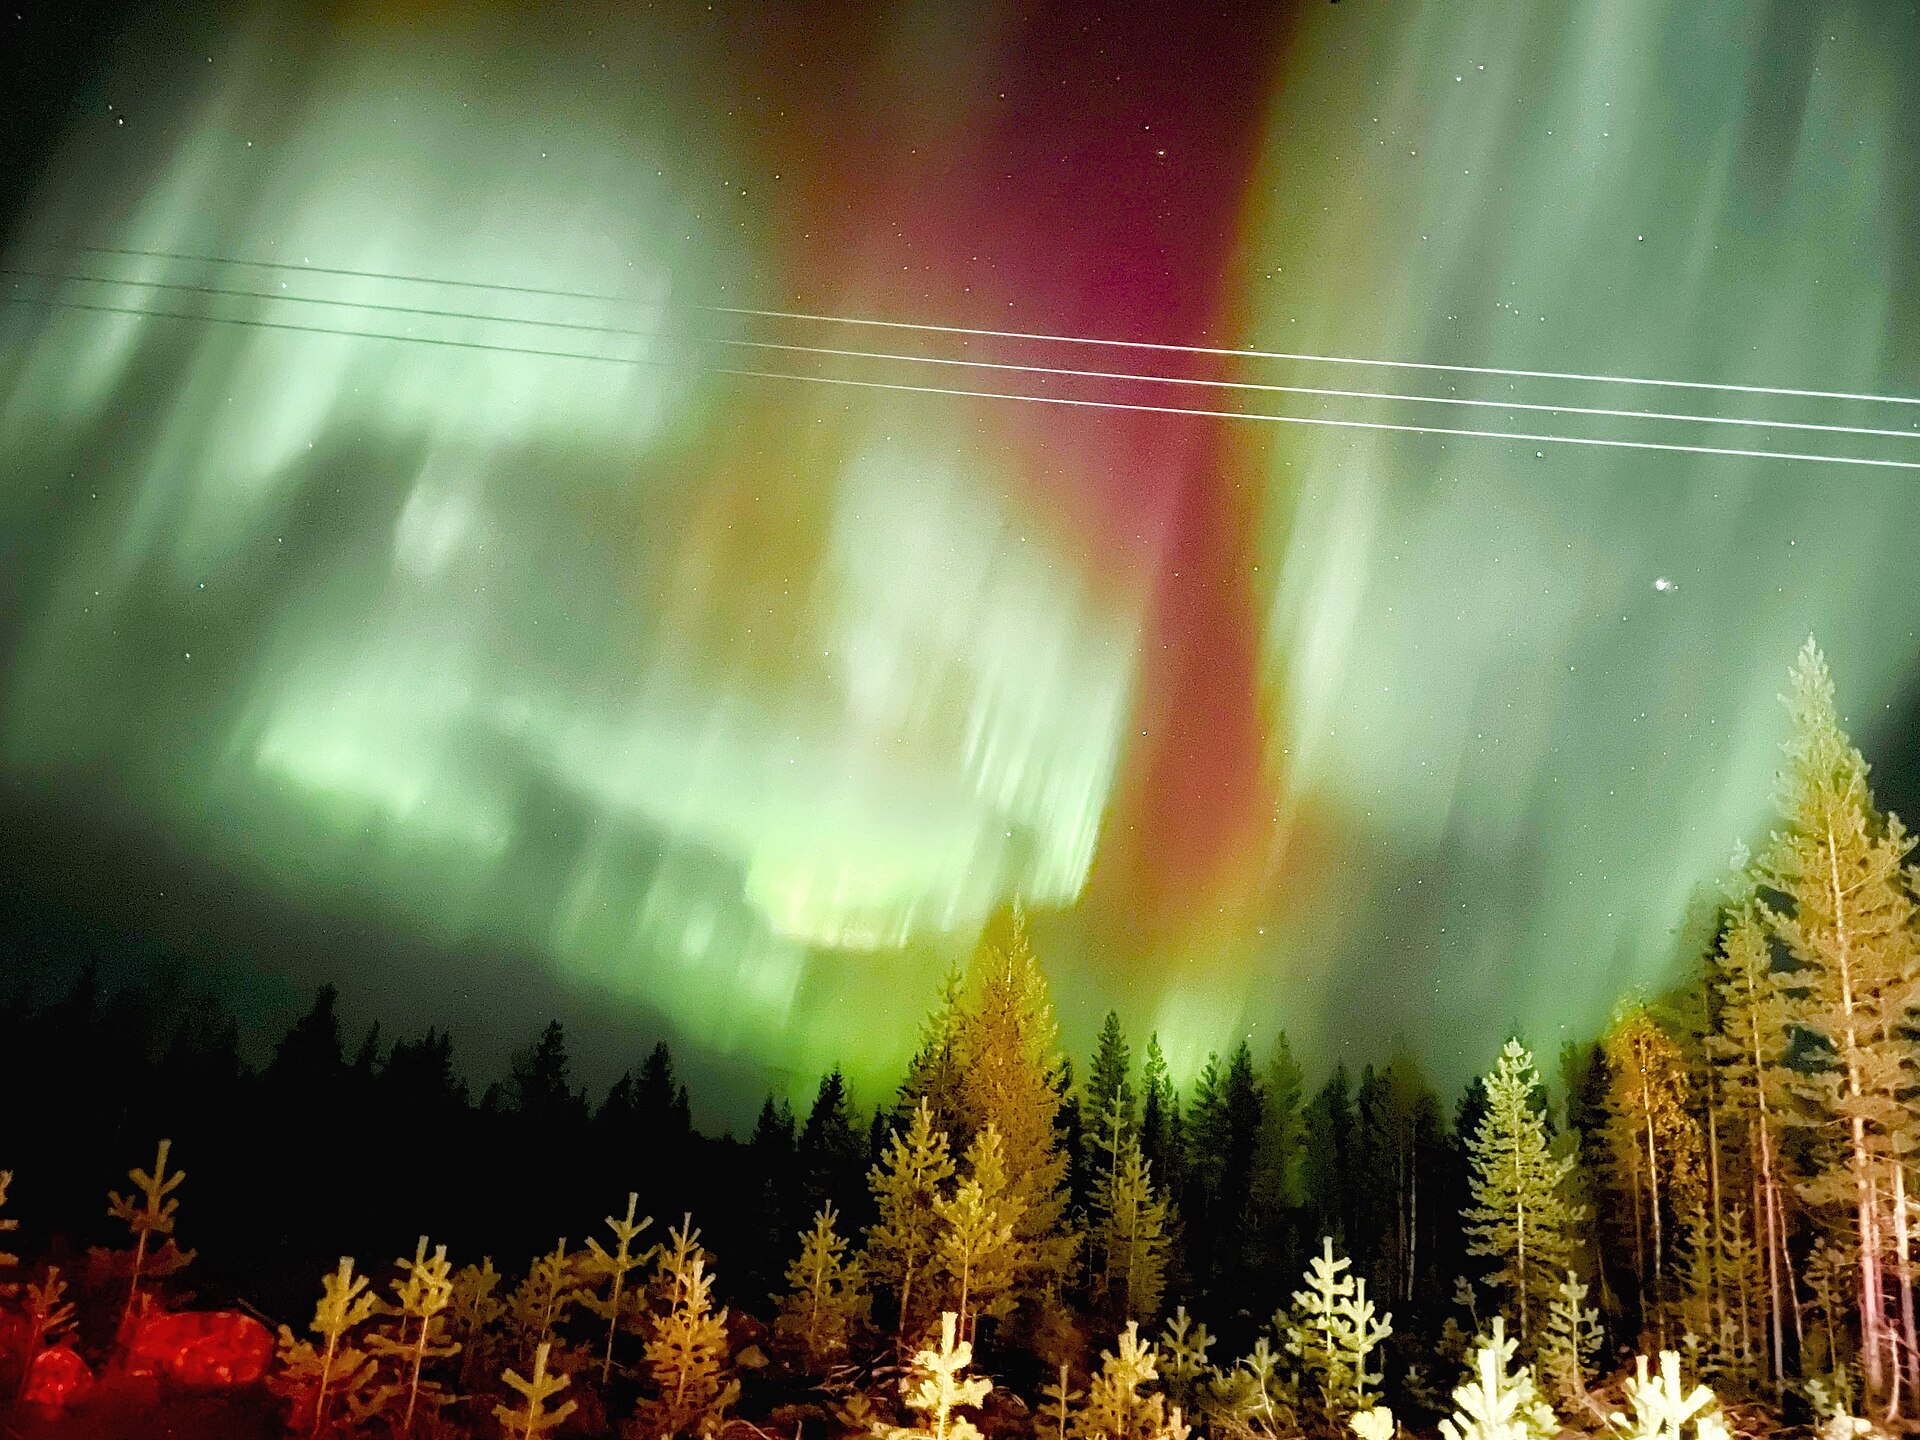
Great red auroras are rare because they require a perfect mix of heavenly conditions. Pure red forms much higher, from about 200 to 300 miles up, where oxygen remains and electrons produce red light as pure as a laser. Red auroras have to be 10 times as bright as green auroras for that color to be visible to the naked eye. Cameras and phones that can capture more light wavelengths than the human eye sometimes show red in aurora photos in which the photographer only saw greens.
4. Forecasting and the Kp Index
Auroral forecasting is commonly expressed through the planetary K index, or Kp, a scale running from 0 to 9 that was introduced in 1939 by the German scientist Julius Bartels. At its lowest values the aurora stays far to the north and remains dim. As Kp rises through the range of 3 to 5 the aurora moves away from the poles and grows brighter, with more motion and more varied formations. At Kp 8 to 9 it is pushed toward the equator, very bright and active, with the extended oval overhead from the northern states of the USA. A Kp above 5 marks the threshold of a geomagnetic storm.
A 30-minute aurora forecast product is built on the OVATION model, which stands for Oval Variation, Assessment, Tracking, Intensity, and Online Nowcasting, an empirical model of auroral intensity developed at the Johns Hopkins University Applied Physics Laboratory. It projects the location and intensity of the aurora 30 to 90 minutes ahead. Forecast lead time is defined as the solar wind travel time from the L1 observation point to Earth. When input data are contaminated or unavailable, the product falls back to a current-Kp estimate with no lead time. NASA TIMED GUVI data were added so that Kp 8 and 9 values could be captured beyond the DMSP-only version, which is reliable to Kp 7.
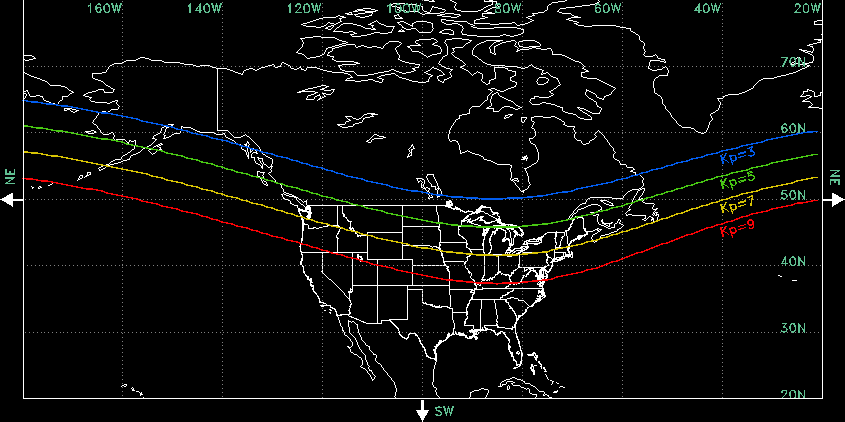
NOAA's Geomagnetic Forecast projects activity for the next three UTC days in 3-hour intervals, updated daily at 22:05 UTC. Some aurora is always occurring somewhere on Earth, but the sky must be dark and at least partly clear for it to be visible, and a calm solar wind can leave it faint and confined to very high latitudes. Active displays become more diffuse and fragmented later in the night, so 9 p.m. is the higher-probability window over interior Alaska in winter. Auroras can be predicted, though not guaranteed, hours or days ahead of time from observations of the sun, satellite measurements of the solar wind and modelled changes in geomagnetic activity.
5. Viewing Conditions and Practical Notes
Digital camera sensors are sensitive enough to record auroras that the naked eye cannot see. On a clear night the chance of observing an aurora in Tasmania averages around 1% to 2% and is strongly correlated with the sunspot cycle. The earlier in the evening an auroral display is seen in the southern sky the more likely it is that the display will become more spectacular and more overhead around midnight.
6. Historical Observations and Research
George Siscoe assembled reasons to believe that the term aurora borealis was introduced by Galileo Galilei in 1619, though the phrase was already in use in 1621 by the French scientist and philosopher Pierre Gassendi. Elias Loomis of Yale University compiled in 1860 a map marking how many times in an average year auroras were observed at various locations. Kristian Birkeland conducted a magnetized terrella experiment inside a vacuum chamber, in which a beam of electrons was steered by the magnetic field toward the sphere's poles.
Detectors aboard a rocket launched into the aurora by Meredith, Gottlieb and Van Allen in 1954 produced the first observations of auroral electrons. A rocket experiment in 1959 identified the particles as electrons accelerated by 6000 volts.
Auroral forms of all types and colors were seen below 50 degrees latitude for about 24 hours on August 28-29 and about 42 hours on September 2-3; at its height it was a blood or deep crimson red so bright one could read a newspaper by it. Richard Carrington and a second observer independently became the first to observe a white light flare on 1 September 1859 while watching a large sunspot group. Ionospheric currents ran so strong that magnetometers frequently went off scale and telegraph systems became inoperable.
A barrage of large solar flares and coronal mass ejections in the first full week of May sent clouds of charged particles toward Earth, creating the strongest solar storm to reach the planet in two decades. Eight X-class flares occurred between 7 and 11 May, with the strongest peaking at X5.8, alongside at least seven coronal mass ejections. The ejections bunched in waves that reached Earth from May 10 onward, creating a long-lasting storm not seen since 2003 and rated G5 at the top of the geomagnetic storm scale. By the disturbance storm time index the event was similar in strength to the historic storms of 1958 and 2003, with auroras reported as low as 26 degrees magnetic latitude. NOAA's Space Weather Prediction Center issued pre-storm alerts to power grid and commercial satellite operators, and NASA's ICESat-2 entered safe mode likely because of increased drag.
The 1989 geomagnetic storm stands as the most severe on record since an event in 1921, causing power blackouts in Canada and the US along with radio communication blackouts and satellite anomalies. A fast, dense gust of solar wind passing Earth can temporarily compress the planet's magnetic field, and the resulting change in field strength can burn out power grid transformer stations and cause blackouts.
7. Auroras Beyond Earth
Astronomers turned NASA's Hubble Space Telescope toward the poles of Jupiter, the largest planet in the solar system, and photographed its auroras in far-ultraviolet light as NASA's Juno spacecraft approached and entered orbit. The Hubble program was designed to establish how Jupiter's auroras answer to shifting conditions in the solar wind, the outflowing solar wind. Such displays arise when charged particles are accelerated along a planet's magnetic field to high energies and strike the atmosphere near the magnetic poles, setting it aglow. The scale of the Jovian case is set by its magnetosphere, which is 20,000 times stronger than Earth's.
8. Cultural Significance
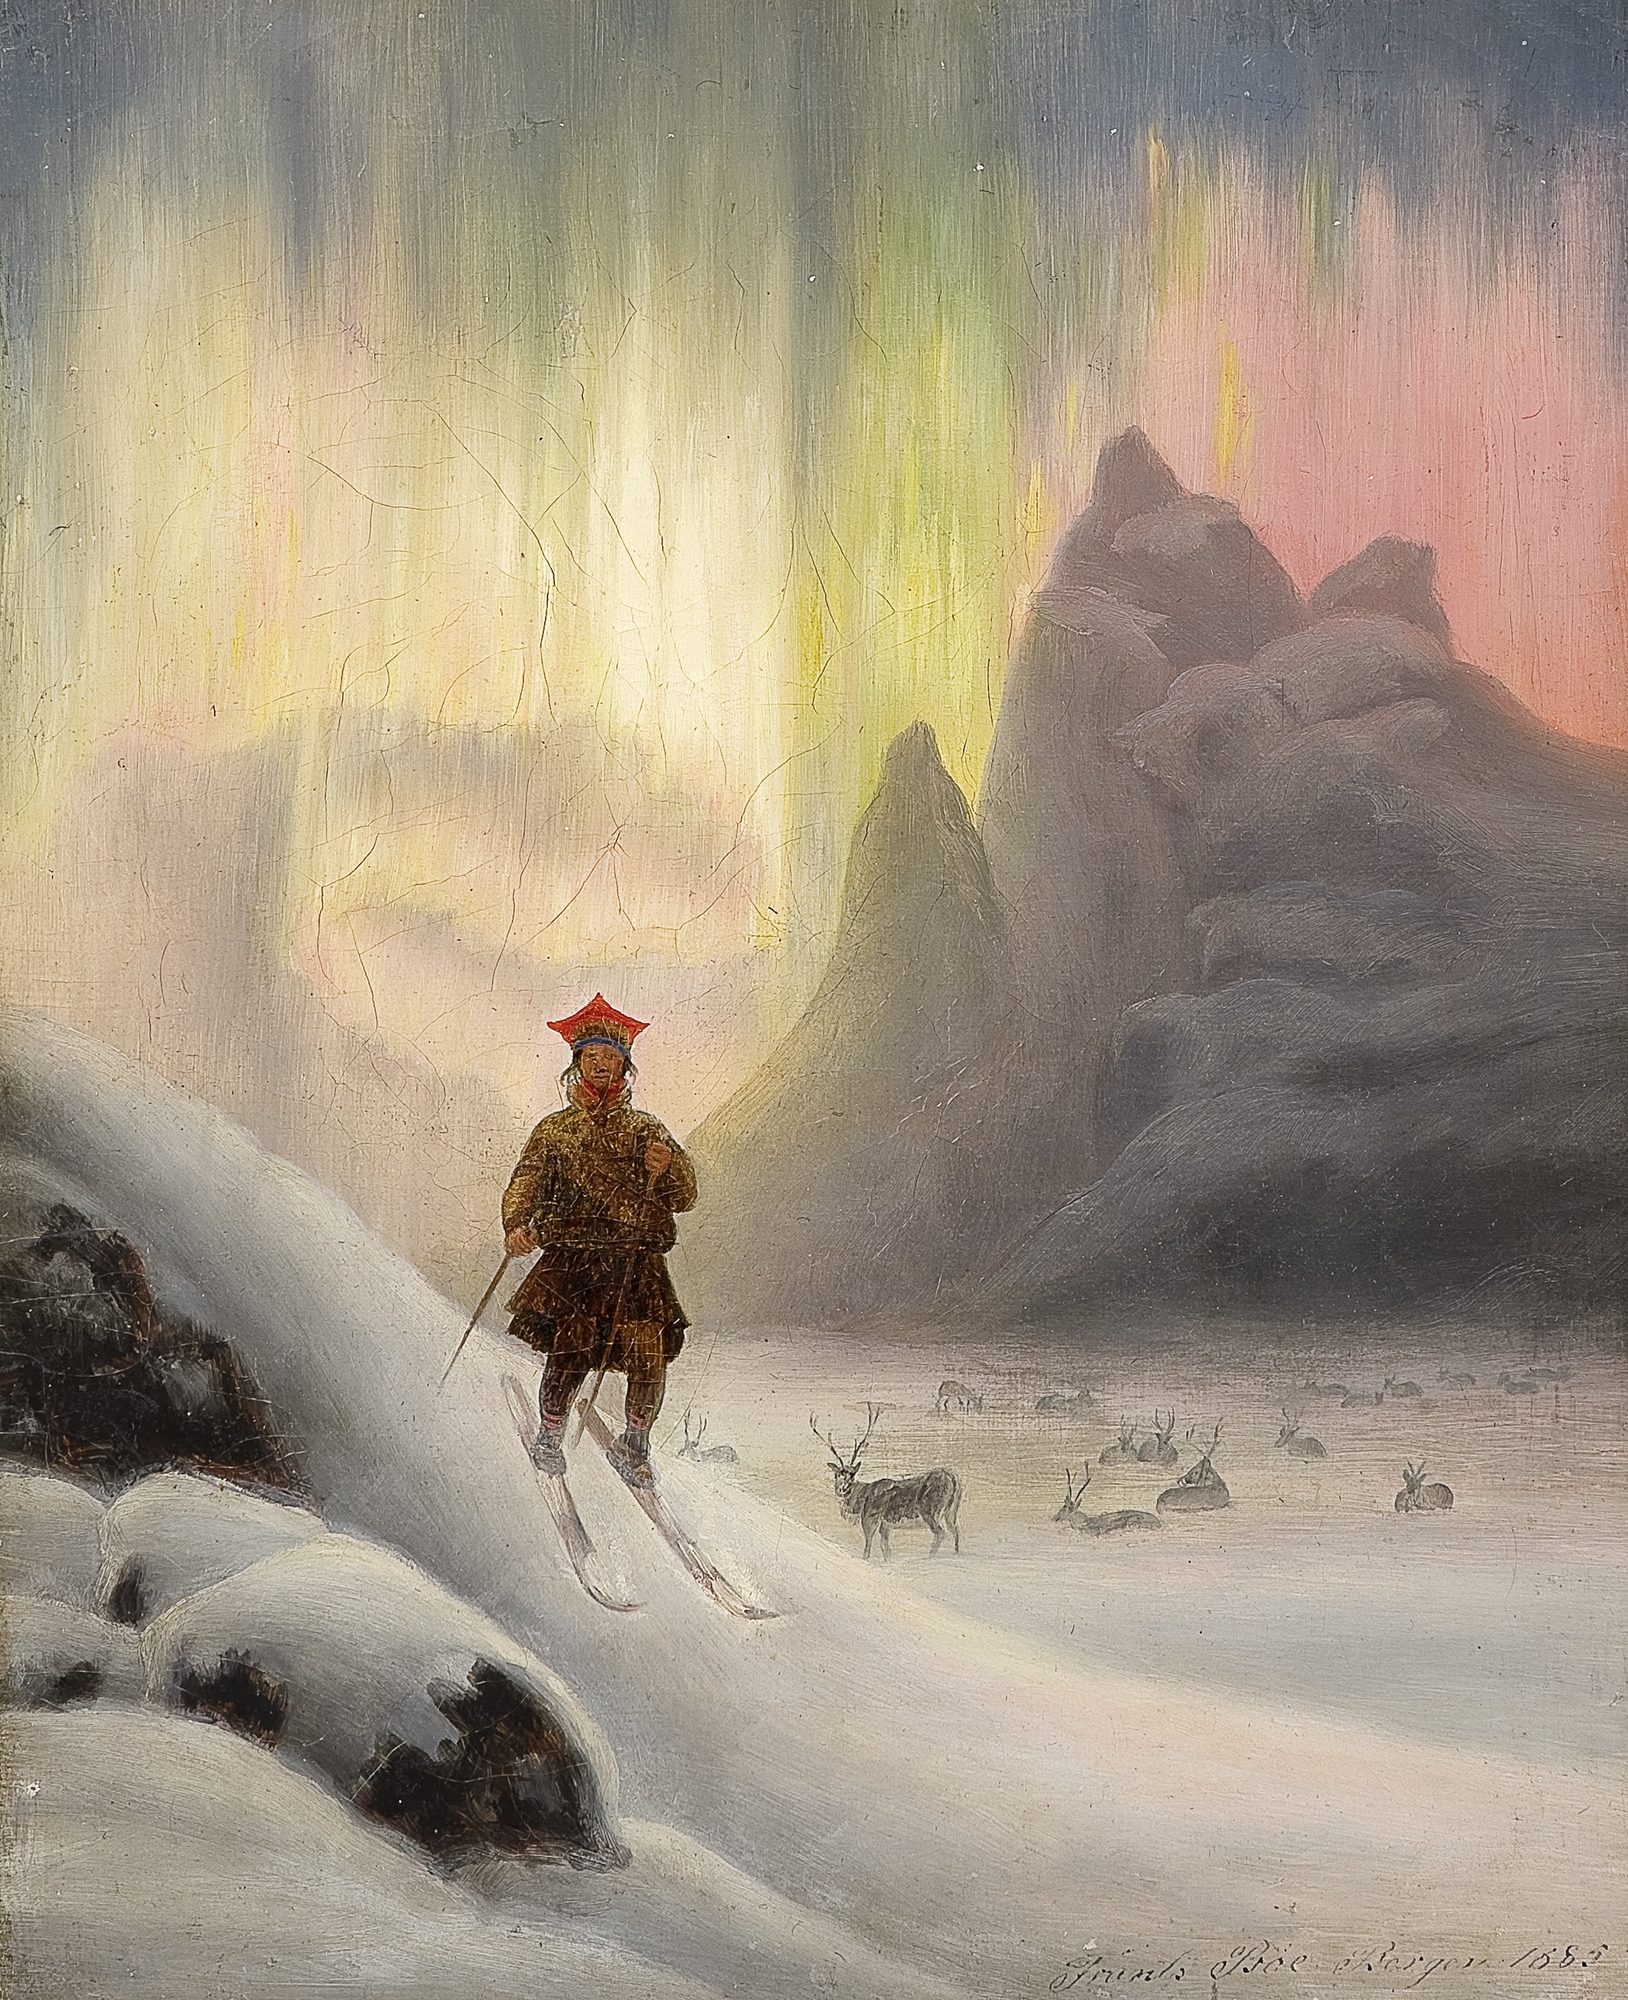
The northern lights have held great cultural importance for many peoples for thousands of years, and to many such as the Cree and Inuit they symbolize spirits dancing across the sky. For many Indigenous peoples they represent the spirits of ancestors and a connection to the spirit world, and they are treated with great respect and reverence.
Nicholas Flowers notes that the behaviour of the northern lights can help predict weather, since still lights suggest fair weather and light winds the following day while quickly dipping lights suggest less ideal conditions.
9. Key Dates
-
1619Term introducedGeorge Siscoe has given reasons to believe the term aurora borealis was introduced by Galileo Galilei. 17The Polar Aurora · NASA Goddard Space Flight Center (Polar Wind education pages) ↗
-
1621Term usedThe term was used by the French scientist and philosopher Pierre Gassendi. 17
-
1954First auroral electron observationsDetectors aboard a rocket launched into the aurora by Meredith, Gottlieb and Van Allen made the first observations of auroral electrons. 17
-
1959Electrons identifiedA rocket experiment identified the particles as electrons accelerated by 6000 volts. 17
10. Frequently Asked Questions
What is the Kp index and what does it measure?
The planetary K index, or Kp, indicates the level of geomagnetic activity. It runs from 0 to 9, and at its lowest values the aurora stays far north and quite dim. 18Tips on Viewing the Aurora · NOAA Space Weather Prediction Center ↗
Where is the aurora most often seen?
At Kp 8 to 9 the aurora pushes further towards the equator and becomes very bright and very active, with the extended oval visible directly overhead from the northern states of the USA. 18
When do auroras occur more frequently?
As the sun approaches solar maximum, the time of greatest activity in the roughly 11-year solar cycle, auroras occur more frequently along with more intense geomagnetic storms. 3The Science, Beauty and Mystery of Auroras · NOAA National Centers for Environmental Information ↗
11. Timeline
- 1621Gassendi names the aurora borealisThe French scientist and philosopher Pierre Gassendi used the term aurora borealis; NASA history notes that George Siscoe argued it was introduced by Galileo Galilei in 1619 instead.
- 1 September 1859Carrington observes a white-light solar flareWhile observing a large sunspot group, Richard Carrington and a second observer independently became the first to record a white light flare. Within about seventeen hours the Earth experienced the great auroral display of 2 to 3 September, and the storm of 1859 became the most famous space weather event of the last two centuries.
- 1860Loomis maps aurora frequencyElias Loomis of Yale University compiled a map marking how many times in an average year auroras were observed in various locations.
- 1881Fritz publishes a more accurate aurora mapHermann Fritz compiled a more accurate map of how often auroras were seen than the one Elias Loomis had produced two decades earlier.
- 1913Birkeland builds a larger terrellaKristian Birkeland constructed a much larger terrella experiment in a bigger vacuum chamber; the device was later restored and shown to visitors at the Auroral Observatory in Tromsø, Norway.
- 1921A major storm sets an early benchmarkThe 1921 event stood as the most severe geomagnetic storm on record until the storm of 1989 surpassed it.
- 1939Bartels introduces the Kp indexThe German scientist Julius Bartels introduced the Kp index, the planetary scale of geomagnetic activity that remains the basis of aurora forecasting.
- 1954Rockets observe auroral electrons directlyDetectors aboard a rocket launched into the aurora by Meredith, Gottlieb and Van Allen measured auroral electrons for the first time.
- 1958Parker sets out the theory of the solar windEugene Parker developed the first theory of the solar wind, the stream of charged particles that carries solar material outward through the solar system.
- 1959McIlwain measures auroral electron energiesCarl McIlwain used a rocket experiment to identify the particles as electrons with an average energy corresponding to acceleration by 6000 volts.
- August 1972Aurora reaches MiamiDuring intense geomagnetic activity the auroral oval expanded as far south as Miami, Florida, one of the lowest-latitude auroral reaches recorded.
- 1989The 1989 storm causes blackoutsThe 1989 geomagnetic storm was the most severe on record since the 1921 event, and it caused power blackouts in Canada and the United States along with radio communication blackouts and satellite anomalies.
- 2003The 2003 storms set the G5 benchmarkThe storms of 2003 were the last to reach the G5 rating on the geomagnetic storm scale before the May 2024 event, which was compared with them by the disturbance storm time index.
- 2020SWPC puts OVATION 2020 into operationsNOAA's Space Weather Prediction Center implemented OVATION 2020 into operations as a new version of the OVATION Prime aurora model.
- 10 May 2024An extreme G5 storm drives auroras to low latitudesA barrage of coronal mass ejections that reached Earth from 10 May produced the strongest solar storm to reach the planet in two decades; auroras were reported as low as 26 degrees magnetic latitude.
References (20)
- 1Aurora — NOAA Space Weather Prediction Center WebView source
- 2Aurora — Australian Antarctic Program WebView source
- 3The Science, Beauty and Mystery of Auroras — NOAA National Centers for Environmental Information Web↩View source
- 4Auroras on Jupiter — NASA Science (Hubble Space Telescope) WebView source
- 5What Is the Solar Wind? — NASA Science WebView source
- 6Geomagnetic Storms — NOAA Space Weather Prediction Center WebView source
- 7Coronal Mass Ejections — NOAA Space Weather Prediction Center WebView source
- 8Magnetosphere and Ionosphere — NASA Science WebView source
- 9Northern Lights — The Canadian Encyclopedia (Historica Canada) WebView source
- 10Auroral Emission Lines — Swedish Institute of Space Physics (IRF), doctoral thesis chapter WebView source
- 11Red Aurora Rare Enough to Be Special — University of Alaska Fairbanks Geophysical Institute WebView source
- 12Auroras — Australian Antarctic Program WebView source
- 13Auroras — NASA Science WebView source
- 14Duration and Extent of the Great Auroral Storm of 1859 — NASA Technical Reports Server (Green and Boardsen, Advances in Space Research) 1859 WebView source
- 15How NASA Tracked the Most Intense Solar Storm in Decades — NASA Science WebView source
- 16How Indigenous traditional knowledge is improving our understanding of aurora borealis — CBC Radio, Unreserved WebView source
- 17The Polar Aurora — NASA Goddard Space Flight Center (Polar Wind education pages) Web↩View source
- 18Tips on Viewing the Aurora — NOAA Space Weather Prediction Center Web↩View source
- 19Aurora Forecast — University of Alaska Fairbanks Geophysical Institute WebView source
- 20Aurora - 30 Minute Forecast — NOAA Space Weather Prediction Center WebView source
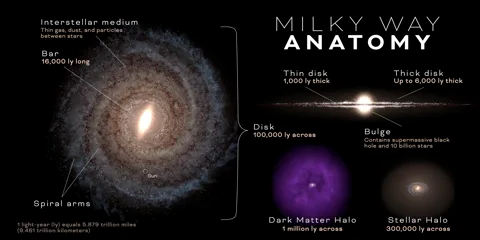 The Milky Way
 The Big Bang
 Voyager 1: Interstellar Explorer